The transportation director opens the monthly fuel report. Bus 14 shows 9 gallons more than baseline. It has been doing this for 47 days. That is 423 extra gallons -- $1,628 of the district's money -- gone before anyone caught it. And it took a monthly reconciliation cycle to surface, which means it will keep running until Monday. A real bus fuel reconciliation template -- with the exception flags built in and the discipline to run it weekly -- is the difference between catching that leak on day three, or day forty-seven.
Bus Fuel Reconciliation Template: Card vs Pump vs Odometer
The three-way match workbook, exception logic, and driver review process that catches fuel card fraud, MPG drift, and route waste before they compound -- built for school districts, transit agencies, and motorcoach operators.
- 3-way match logic
- 6 exception flags
- Weekly cadence
What Fuel Leakage Actually Costs a Bus Fleet
Fuel is the second largest operating cost on every bus fleet, after driver wages. It accounts for 30-40% of total fleet operating expense per the U.S. Bureau of Transportation Statistics. And industry data consistently shows 6-15% of that annual fuel budget disappears to theft, fraud, and unmonitored waste before a single productive mile is driven.
- 6-15% Annual fuel budget lost to fraud, theft, or waste
- $8K-$22K Losses surfaced in the first week of real-time reconciliation
- $40 → $1,200 One anomaly on day 1 becomes this by day 30 unchecked
- 2-3 days Manual monthly reconciliation time for a 50-bus fleet
The numbers are not the shocking part. The shocking part is that most fleets already have the data -- fuel card statements, pump receipts, odometer readings from drivers or telematics. They just do not reconcile fast enough to catch a leak while it is still small. Book a demo to see automated fuel reconciliation running on real fleets.
The Three-Way Match: What Reconciliation Actually Compares
Fuel reconciliation is fundamentally a three-way match. Each of the three sources tracks a different piece of the same event. When they line up, the fill was legitimate. When they do not, something needs a second look.
-
Card Transactions
What the fuel card provider (WEX, Fuelman, Comdata, Voyager, EFS) says was purchased -- date, time, station, gallons, cost, driver ID.
Source of record -
Pump Receipt
The Level 3 detail from the physical dispense -- gallons pumped, price per gallon, and pump-side odometer entry (if the driver keyed one in).
Physical proof -
Odometer & GPS
Miles actually driven -- either from the driver-entered pump odometer or from telematics (Samsara, Geotab). This is what turns gallons into MPG.
Reality check
Any two agreeing is not enough. The card can say 40 gallons and the pump can say 40 gallons, but if the bus only drove 88 miles between fills at a baseline of 6 MPG, the extra 25 gallons went somewhere. That is the whole point of the third check -- and why odometer-linked reconciliation catches what card-only auditing never sees.
The 6 Exception Flags Every Template Must Catch
A reconciliation template that only shows totals is not doing the work. The exceptions are the value. These six flags catch the vast majority of real-world fuel leakage on bus fleets. Sign up free to see how BusCMMS runs all six flags automatically. Fleets that catch even one $40 anomaly per week recover more than the platform costs. Book a demo to see the six flags running on a live fleet.
+ Tap any flag to see a real-world scenario
01
Overfill
Transaction gallons exceed the bus tank capacity. Either data error -- or fuel into a container.
>100% tank capReal scenario: Bus 08 has a 90-gal tank. Transaction shows 112 gal. Someone brought a jerry can.
What it saved: 22 gal per event, ~$85 -- caught in the flag before the next fill.
02
MPG Anomaly
Actual MPG deviates from that bus's rolling baseline. Signals mechanical drift, driver behavior, or diversion.
>15% deviationReal scenario: Bus 14 baseline 6.2 MPG, running 4.8 MPG for 47 days. Turbo boost drift.
What it saved: $1,628 in extra fuel + a $2K turbo cleaned at PM instead of replaced.
03
Double-Swipe
Two fills on same card within 2 hrs with combined volume near tank cap. Classic card-fraud pattern.
<2 hr apartReal scenario: Card swiped at 6:14 AM (65 gal) and 7:52 AM (28 gal). Bus can't hold 93 gal.
What it saved: 28 gal into a second vehicle, ~$108 per event -- pattern-detected.
04
Off-Hour Fueling
Fuel purchase outside operating hours -- weekends, late nights, holidays. Should not happen on a bus card.
Outside scheduleReal scenario: Saturday 11:07 PM transaction on a card set for Mon-Fri routes only.
What it saved: Personal-vehicle fill on district card -- caught same-week, not month-end.
05
Odometer Variance
Driver-entered odometer differs from GPS/telematics by more than a few percent. Almost always tampering or mis-entry.
>2% varianceReal scenario: Driver typed 84,120 at pump. Samsara odometer was 82,650. That is 1.8% -- flagged.
What it saved: Manipulation to hide over-fueling; MPG report would have looked normal.
06
GPS Location Mismatch
Card location does not match where the bus actually was at that timestamp. Immediate red flag.
Distance >X miReal scenario: Card used at station 32 mi from bus GPS location. Card cloned or lent.
What it saved: Full fill (~$280) blocked at authorization -- card frozen same hour.
Inside the Template: What the Workbook Contains
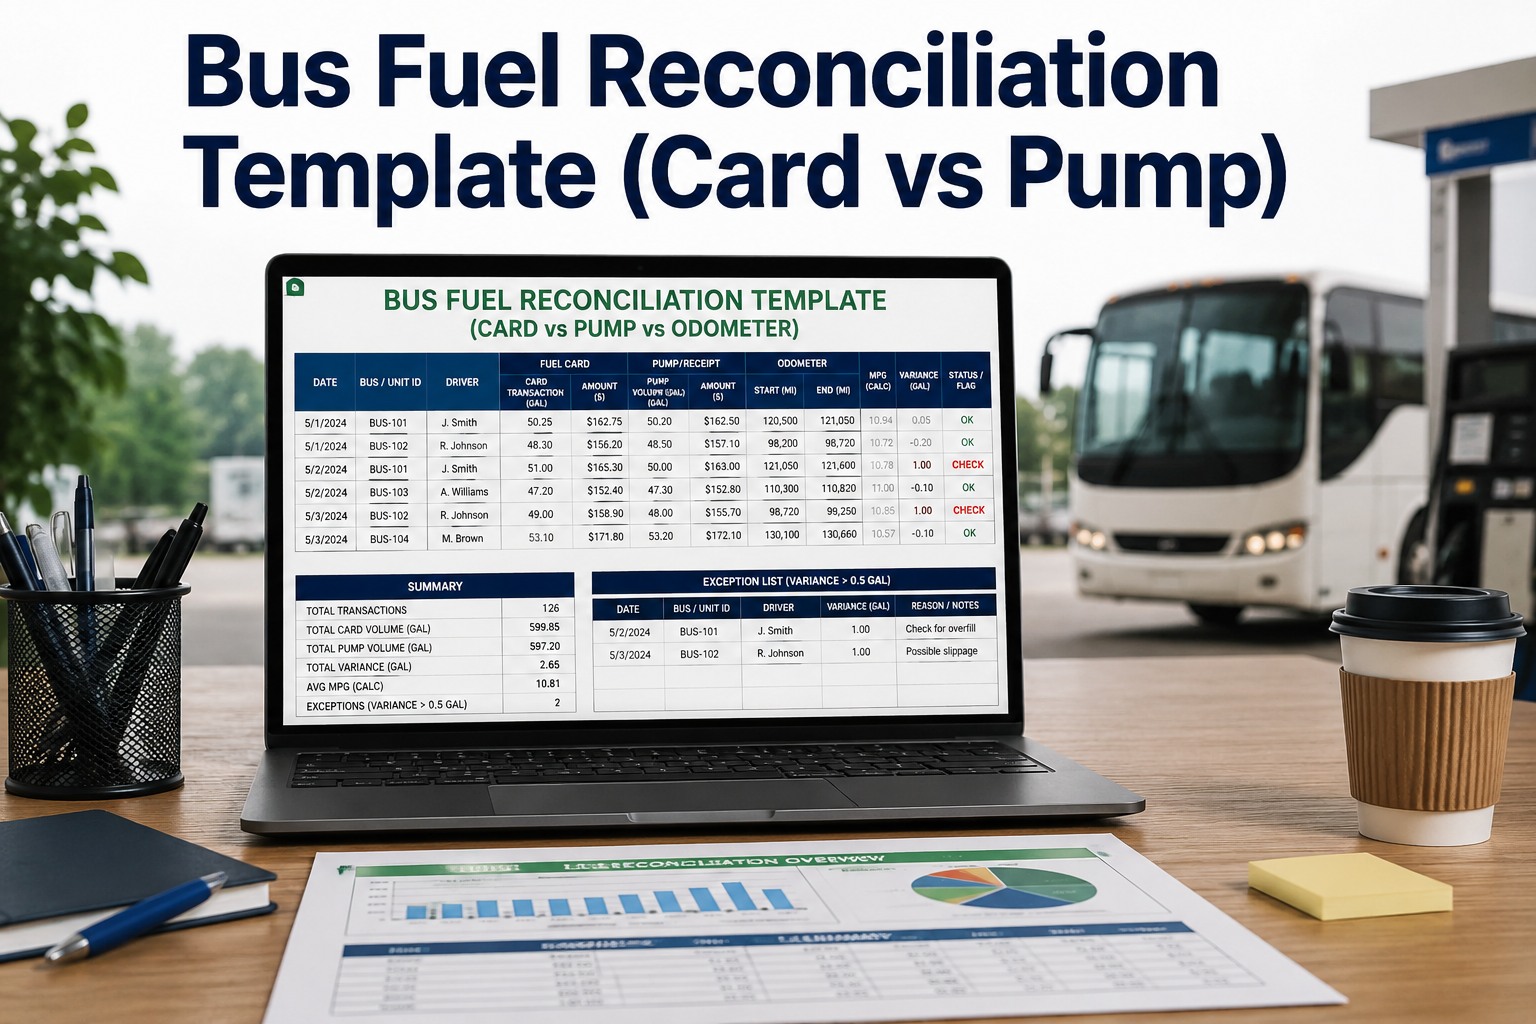
The template is a five-sheet Excel workbook that mirrors how experienced fleet operators actually reconcile. Import your fuel card export into Sheet 1, keep your MPG baseline in Sheet 2, and let the formulas surface the exceptions.
Sheet 1 · Transaction Log
Raw import from fuel card -- date, time, bus #, driver, gallons, cost, station, odometer.
Columns in this sheet:- Transaction Date
- Time (24h)
- Bus / Vehicle #
- Driver ID
- Gallons
- Cost / Gal
- Total $
- Station Name
- Odometer (pump)
- Card Last 4
Sheet 2 · MPG Baseline per Bus
Rolling 30/90-day MPG per unit. Used as the deviation trigger for the exception logic.
Columns in this sheet:- Bus #
- Fuel Type
- Tank Cap (gal)
- Route Type
- 30-Day MPG
- 90-Day MPG
- Baseline MPG
- Upper Limit
- Lower Limit
- Last Updated
Sheet 3 · Exception Report
Auto-populated: every transaction flagged by one or more of the six rules, sorted by dollar impact.
Columns in this sheet:- Flag Type
- Bus #
- Driver
- Transaction Date
- Dollar Impact
- Trigger Value
- Status
- Assigned To
- Resolution Date
- Notes
Sheet 4 · Driver Summary
Per-driver total gallons, average MPG, exception count. Fastest way to spot outlier behavior.
Columns in this sheet:- Driver Name
- Employee ID
- Buses Driven
- Total Gallons
- Total $
- Avg MPG
- Fleet Rank
- Exception Count
- Route Efficiency
- Coaching Flag
Sheet 5 · Monthly Rollup
Board-ready summary: total spend, cost per mile, exceptions resolved, dollars recovered.
Columns in this sheet:- Month
- Total Gallons
- Total Spend
- Fleet MPG
- Cost / Mile
- Exceptions Flagged
- Exceptions Resolved
- $ Recovered
- vs Prior Month
- YTD Trend
The workbook works. But it depends on someone actually opening it weekly and running the formulas -- which is exactly where most fleets slip. Book a demo to see the same logic running automatically on your fleet.
When Excel Stops Being Enough: Manual vs Automated Reconciliation
The Excel template works for smaller fleets. But once you cross roughly 20 buses or $50K in monthly fuel spend, the math on manual reconciliation stops working. Here is where the line actually is.
The Template Approach
- Cadence: Monthly at best. Anomalies compound.
- Data entry: Import card CSV + manual odometer per bus.
- Exception logic: Formulas you maintain yourself.
- Time: 2-3 days per 50 buses per month.
- Fraud caught: Only what the fleet manager notices.
- Best for: 5-20 buses, single fuel card, single depot.
The Automated Approach
- Cadence: Daily. Flags fire in near real time.
- Data entry: Card + telematics API, no manual entry.
- Exception logic: All 6 flags built in, per-bus baselines.
- Time: Minutes to review the exceptions queue.
- Fraud caught: Overfill, MPG anomaly, GPS mismatch, off-hour.
- Best for: 20+ buses or any multi-depot / multi-card fleet.
The break-even is fast. A single caught anomaly averaging $40 that would have compounded to $1,200 over 30 days more than pays for the platform for the month. Multiply that across a fleet and the ROI question stops being a question. Book a demo to see the payback on your specific fleet size.
A Transportation Director's Take
We were doing reconciliation on the 5th of the month for the prior month. The first week we ran it daily, we found four buses with MPG drops nobody had noticed and one driver whose fill pattern did not match any actual route. That was $4,800 of recovered fuel spend in three weeks -- and the driver conversation was overdue anyway. Now the report runs itself and I look at exceptions instead of statements.
What is a bus fuel reconciliation template and how does it work?
A fuel reconciliation template is a workbook -- typically Excel for smaller fleets -- that performs a three-way match between fuel card transactions, physical pump receipts, and odometer readings. You import the fuel card export into the transaction log, maintain a rolling MPG baseline per bus, and the exception logic surfaces any transaction that fails one or more of six rules: overfill beyond tank capacity, MPG anomaly greater than 15% deviation, double-swipe within two hours, off-hour fueling, odometer variance greater than 2% from GPS, and location mismatch between the pump and the actual vehicle position. The exceptions get reviewed weekly and the resolved items feed a monthly rollup for the board.
How often should a bus fleet reconcile fuel data?
Weekly is best practice for any fleet over 20 buses or $50,000 in monthly fuel spend, and daily is best practice once you can automate it. Monthly reconciliation feels reasonable on paper but has a well-documented cost: a $40 anomaly on day one becomes a $1,200 problem by day 30 -- and it is still running on day 31. Fleets switching from monthly to real-time reconciliation typically surface $8,000-$22,000 in previously undetected losses in the first week alone. These are not new losses; they are ongoing ones that were never flagged.
What are the most common fuel card fraud patterns on bus fleets?
Five patterns account for most fraud on commercial bus fleets. First, driver personal-vehicle fills -- often rationalized as "a perk" rather than theft. Second, double-swipe fraud where the card is swiped twice for one physical fill, with the second transaction funding a friend's vehicle. Third, phantom fills where a driver reports a purchase that never happened. Fourth, off-network purchases at higher-priced stations that do not follow route logic. Fifth, odometer manipulation to hide over-fueling relative to actual miles driven. A template with all six exception flags built in catches all five patterns before they compound.
What MPG should a bus actually get?
The realistic operating ranges for U.S. bus fleets: mixed-route school buses typically get 5.0-7.0 MPG. Transit buses with frequent stops get 3.5-5.0 MPG. Charter and motorcoach highway buses get 6.0-8.5 MPG. Electric buses are measured in kWh per mile and reconciled the same way with a different unit. What matters is not the absolute number but the per-bus baseline -- a specific bus that suddenly drops from 6.2 MPG to 4.8 MPG has a real problem, whether that is a maintenance issue, a driver behavior issue, or fuel that never went into the tank.
Does BusCMMS integrate with our existing fuel card provider?
Yes. BusCMMS integrates with the major fuel card networks used by U.S. bus fleets -- WEX (Wright Express), Fuelman, Voyager, Comdata, EFS, and most regional fuel card providers. Transactions import automatically with full Level 3 detail -- driver ID, vehicle ID, odometer, gallons, price per gallon, station, timestamp -- and get cross-referenced against Samsara or Geotab telematics data (if you use them) for GPS location and true odometer. The reconciliation runs continuously; the exceptions queue is what you actually look at each morning.