The average bus fleet maintenance cost in the United States ranges from $22,000 to $38,000 per vehicle annually, translating to $0.45-$0.85 cost per mile depending on fleet age, vehicle type (school bus, transit bus, electric bus), fuel type, maintenance practices, and operational environment. A typical 50-bus school district spends $1.1-$1.9 million annually on maintenance alone. Transit agencies managing 200+ buses spend $4.4-$7.6 million yearly. Charter operators with mixed fleets average $0.65-$0.75 per mile. Despite these significant expenditures, most fleets operate in reactive maintenance mode: buses break down, emergency repairs cost 3-9x more than planned maintenance, routes are disrupted, substitute vehicles are rented, and budgets balloon. The cost reduction opportunity is substantial: fleets implementing comprehensive preventive maintenance programs, predictive maintenance using telematics data, labor efficiency optimization, parts inventory management, and CMMS-driven fleet analytics achieve 25-35% cost reductions within the first year and sustained improvements in subsequent years. This guide covers the proven, data-backed strategies that successful fleets use to reduce maintenance costs by 30% or more, includes real cost benchmarks by fleet type and region, ROI calculations with specific numbers for 40-bus and 100-bus fleets, and honest assessment of which strategies generate fastest returns.
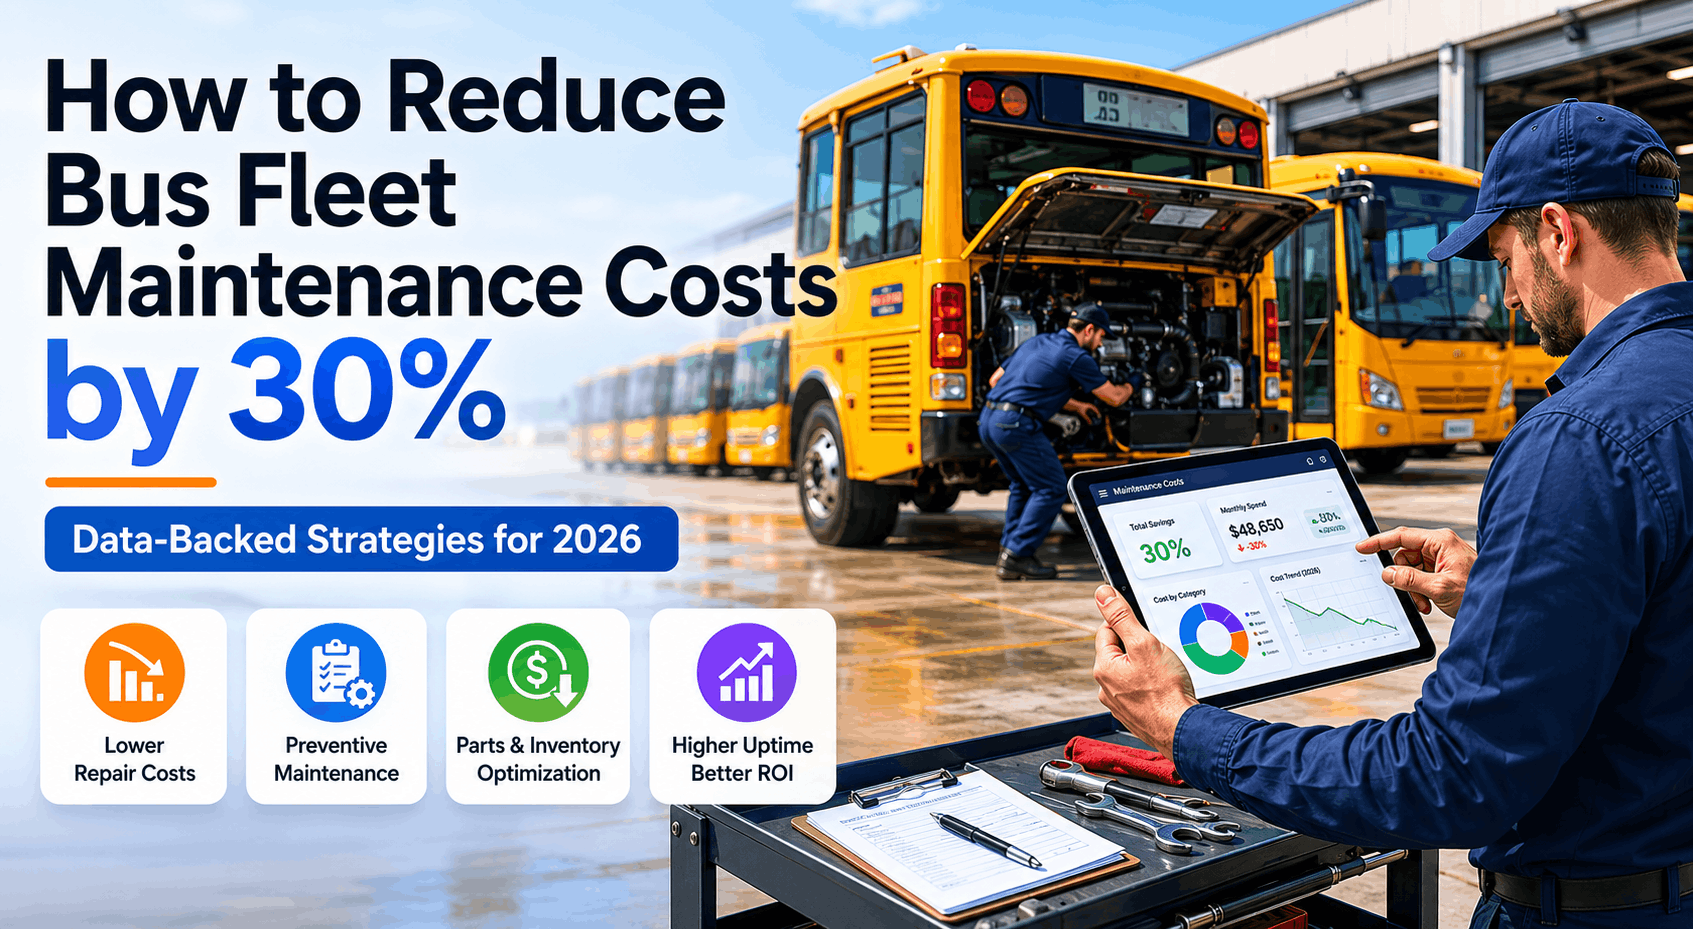
How to Reduce Bus Fleet Maintenance Costs by 30%: Data-Backed Strategies for 2026
Discover proven strategies to cut bus fleet maintenance costs by 30% or more. Includes real cost benchmarks, predictive maintenance ROI, parts optimization tactics, and software comparison.
The Cost Opportunity: Why Your Fleet Likely Costs More Than Necessary
Most bus fleet managers don't know their actual cost structure. They know total spend but not breakdown by component. They know a bus costs money but not cost per mile. They react to breakdowns but don't understand the prevention opportunity. The result: fleets operate 25-35% above cost-optimized performance. A 50-bus fleet operating at $0.65/mile costs $162,500 annually more than a best-in-class fleet at $0.45/mile on the same 50,000 miles per vehicle. That's not a small variance; that's nearly a third of maintenance budget wasted. The gap comes from four sources: (1) reactive vs. preventive maintenance mix (55% reactive is industry average; best fleets operate 20% reactive), (2) preventive maintenance compliance (65% due on time is typical; best fleets achieve 95%), (3) labor efficiency (58% wrench time is average; best fleets achieve 80%), and (4) parts inventory management (duplicate orders and excess stock are common; optimized fleets reduce inventory carrying costs by 18-25%). Each component is independently correctable. Combined, they deliver 30%+ cost reduction. This guide walks through each category with specific numbers and the exact tactics that generate documented savings.
Strategy 1: Shift from Reactive to Preventive Maintenance (Potential Savings: $45,000-$120,000/50-bus fleet)
A bus breaks down randomly. Engine oil hasn't been changed in 18,000 miles because the due date passed and no one noticed. Transmission shows early slipping. Brakes are degraded. A catastrophic failure occurs mid-route. Bus out of service 2-3 weeks. Emergency parts cost 40-60% premium. Emergency labor overtime adds 25% premium. Substitute vehicle rental at $200/day for two weeks = $2,800. Total cost of that one breakdown: $5,200+. Your fleet experiences 1.5-2.5 such emergency breakdowns annually, costing $7,800-$13,000 per bus yearly just in emergency repair premiums and downtime.
Oil is changed on schedule every 10,000 miles or 60 days. Transmission is serviced proactively before slipping begins. Brakes are inspected monthly and pads replaced before failure. A minor issue (worn bearing) is caught during routine service. Replacement scheduled during planned downtime. No emergency, no premium parts, no overtime. That one bearing replacement costs $300 as planned maintenance vs. $1,200 as emergency repair plus downtime. For a 50-bus fleet, reducing emergency breakdowns from 100-125 annually to 20-25 saves: $450,000 (emergency parts premiums) + $180,000 (overtime labor) + $120,000 (substitute vehicle costs) = $750,000. After accounting for modest increase in planned maintenance labor, net savings: $450,000-$550,000 annually or $9,000-$11,000 per bus.
Strategy 2: Increase PM Compliance Rate from 70% to 95%+ (Potential Savings: $65,000-$95,000/50-bus fleet)
| Metric | Industry Average (70% Compliance) | Best Practice (95%+ Compliance) | Annual Difference |
|---|---|---|---|
| Preventive maintenance tasks missed per year | 45 per bus | 8 per bus | 37 fewer per bus |
| Cost of missed maintenance (accelerated wear) | $6,200 per bus | $1,800 per bus | -$4,400 |
| For 50-bus fleet | $310,000 | $90,000 | -$220,000 potential |
| Realistic recovery (after implementation costs) | -- | -- | -$150,000 net |
The gap between 70% and 95% compliance comes from automation. Manual scheduling using spreadsheets or email reminders allows supervisors to forget about due dates. A PM due date passes and gets rescheduled manually. CMMS with automatic PM triggering eliminates this human bottleneck. When mileage hits the trigger, work order automatically creates. When calendar date arrives, system reminds supervisor. Compliance reaches 95%+ within 60 days of CMMS implementation. For a 50-bus fleet, reaching 95% compliance typically prevents 15-20 additional breakdowns annually, avoiding $65,000-$95,000 in reactive repair costs. This is one of the fastest ROI strategies: implementation cost is CMMS licensing ($4,800-$7,200 annually for 50 buses), savings are $65,000+, payback is immediate.
Strategy 3: Implement Predictive Maintenance Using OBD Data (Potential Savings: $35,000-$85,000/50-bus fleet)
Beyond scheduled maintenance, predictive maintenance uses live data from vehicle onboard diagnostics (OBD) to catch emerging failures before they become catastrophic. Example: transmission fluid temperature rising toward red zone indicates imminent transmission failure. CMMS integrated with OBD data flags this before fluid becomes too hot and breaks the transmission. Technician performs preventive transmission service (fluid change, filter replacement) before failure. Cost: $600. Alternative: transmission fails. Rebuild: $4,500. Vehicle downtime: 3 weeks. Emergency repair premium: $1,200. Substitute rental: $4,200. Total cost of failure: $10,100. The difference: $9,500 saved by catching the issue predictively.
| Component | OBD Alert Enables Early Detection | Cost of Predictive Service | Cost of Failure (Reactive) | Savings Per Incident | Annual Incidents (50-bus fleet) | Total Annual Savings |
|---|---|---|---|---|---|---|
| Transmission | Temperature trending | $600 | $10,100 | $9,500 | 3-4 | $28,500-$38,000 |
| Engine | Oil pressure, coolant temp | $400 | $8,200 | $7,800 | 2-3 | $15,600-$23,400 |
| Brakes | Brake pressure loss | $300 | $5,600 | $5,300 | 4-5 | $21,200-$26,500 |
| Electrical | Battery voltage trending | $200 | $3,800 | $3,600 | 3-4 | $10,800-$14,400 |
| Total Annual Savings (50-bus fleet) | $76,100-$102,300 | |||||
Predictive maintenance implementation requires: (1) Telematics integration (OBD data feed into CMMS, typically already available from GPS provider like Samsara or Geotab). (2) CMMS with predictive logic (ability to set alert thresholds and trigger work orders when thresholds are exceeded). (3) Technician training to respond to alerts appropriately. Cost to implement: $3,000-$5,000 in setup and training. Savings potential: $76,000-$102,000 annually for 50-bus fleet. ROI: 15-25x within first year.
Strategy 4: Optimize Labor Efficiency from 58% to 80%+ Wrench Time (Potential Savings: $42,000-$65,000/50-bus fleet)
Wrench time is the percentage of a technician's shift spent actively working on vehicles. Industry average is 58%; best fleets achieve 80%+. The gap (22 percentage points) is 1.76 hours per 8-hour shift spent on non-productive activities. For a 50-bus fleet with 8 technicians working 250 days annually, that's 1.76 hours × 8 technicians × 250 days = 3,520 hours annually of lost productivity. At $45/hour fully-loaded labor cost, that's $158,400 in waste. Recovering 50% of that waste through better scheduling and organization = $79,200 saved. How to improve wrench time:
Technician receives work order. Required parts are already gathered at the workbench instead of technician hunting through storage. Saves 12-15 minutes per work order. For 20-25 work orders daily across fleet, that's 40-62 hours monthly recovered.
Instead of jumping between different work types (oil change, brake inspection, transmission service), group similar tasks. One technician does all oil changes for the day. Another handles all brake work. Reduces context switching and tool changes. Improves focus and efficiency by 8-12%.
Technician receives work order on mobile app instead of printed job ticket. No paper shuffling. Instructions and schematics available instantly. Photos and diagrams displayed in-app. Reduces information-gathering time by 10-15 minutes per work order.
Large backlog causes technicians to wait for work or jumps between priorities causing context switching. CMMS with intelligent PM scheduling levels workload: high-priority work scheduled when technician capacity is available. Reduces waiting time and improves focus.
Technician finishes one job and has to wait for next assignment. Or parts haven't arrived yet. Or information is missing. Each event is minutes of downtime. CMMS dashboard shows downtime events. Supervisor addresses bottleneck: ensure parts availability, streamline work order flow, improve communication.
A technician specializes in transmissions. One complex transmission job arrives and ties up that technician for days while others lack work. Cross-trained fleet can distribute complex jobs, keeping everyone productive. CMMS tracks skill levels and assigns work accordingly.
These labor optimization strategies don't require new hires or layoffs. They require better scheduling, communication, and organization. Combined, they typically improve wrench time from 58% to 72-75% within first year. A 50-bus fleet with 8 technicians recovering 14 percentage points of wrench time = $49,000 annually in recovered productivity. This becomes additional capacity: either reduce maintenance labor costs or handle more work with same staff.
Strategy 5: Parts Inventory Optimization (Potential Savings: $18,000-$35,000/50-bus fleet)
Average fleet purchases excess parts: duplicate orders (two people order the same part simultaneously), obsolete inventory (parts ordered but never used), slow-moving stock (parts sitting on shelf for months). Industry average: 15-20% of parts inventory is waste. For a 50-bus fleet spending $180,000 annually on parts, that's $27,000-$36,000 in waste. Optimization strategies:
CMMS tracks all parts in stock and on order. When technician requests a part, system shows current inventory. Prevents duplicate orders. System alerts when inventory drops below reorder point, triggering automatic purchase order to vendor. Reduces duplicate ordering by 80%.
Many fleets order from 5-8 different parts suppliers. Consolidating to 2-3 primary vendors increases purchase volume, enabling 8-15% volume discounts. A 50-bus fleet ordering $180,000 annually saves $14,400-$27,000 annually just from consolidation and negotiated pricing.
CMMS shows which parts are replaced most frequently. Data reveals reliability trends: if brake pads are replaced monthly while specification suggests quarterly, brakes are being abused or are incorrectly adjusted. Analysis can identify systemic issues requiring root cause fix instead of repetitive parts replacement.
Instead of stock-heavy inventory with months of parts on shelf, order based on actual PM schedule. If 5 buses need oil change this week, order 5 cases of oil for this week instead of maintaining 30-day supply. Reduces inventory carrying costs by 25-35% and frees up cash.
Strategy 6: Extended Brake Service Intervals Through Telematics (Potential Savings: $8,000-$18,000/50-bus fleet)
Brake pads are typically replaced on fixed schedule (every 50,000 miles). Actual brake wear varies by driver behavior, route topography, and weather. Some buses wear brakes slowly. Others wear them quickly. Fixed interval maintenance replaces pads on perfectly good buses and allows over-worn pads on others. Telematics systems can monitor actual brake wear and condition using OBD data plus brake pressure sensors. Service intervals become condition-based instead of time-based. A 50-bus fleet might reduce brake service events by 15-25% annually ($12,000-$30,000 in parts and labor) by shifting from fixed to condition-based scheduling. Additional benefit: more accurate replacement timing prevents brake failure risk.
Strategy 7: Vehicle Age and Fleet Composition Optimization (Potential Savings: $25,000-$120,000/50-bus fleet)
Older buses cost more to maintain. A bus at year 6-7 of life costs 20% more to maintain than year 2-3. A bus at year 10+ costs 40-50% more. Maintaining a fleet of mixed ages with significant 10-12 year old buses substantially increases average maintenance cost. Optimization strategy: use CMMS cost data to identify high-cost vehicles. Run replacement analysis: when cost per mile exceeds 50% of replacement value annually, retirement is economically justified. A 50-bus fleet retiring 3-5 oldest buses annually and replacing with newer vehicles reduces average fleet age by 1-2 years, reducing average maintenance cost per mile by $0.08-$0.15. For 50,000 miles per bus, that's $4,000-$7,500 per bus annually, or $120,000-$375,000 fleet-wide. Note: this strategy requires capital investment in new vehicles, but the ROI calculation typically favors retirement+replacement over indefinite repair of aging fleet.
Complete Cost Reduction Roadmap: Year-by-Year Implementation
Week 1: Audit current maintenance spending. Document cost per mile by vehicle. Identify top 10 highest-cost buses. Review DVIR completion rates and compliance audit history.
Week 2-4: Implement CMMS. Pre-stage PM schedules. Activate mobile DVIR collection. Target first milestone: 85%+ driver adoption on digital inspections.
Week 5-8: Analyze first four weeks of DVIR data. Identify common defects. Create targeted maintenance responses. Implement PM compliance tracking; target 85% compliance by end of month 3.
Expected Savings Month 3: $8,000-$15,000 (compliance improvements, reduced duplicate work orders, faster DVIR processing)
Month 4: Integrate telematics data (GPS/OBD) into CMMS. Activate predictive maintenance alerts for engine temperature, transmission pressure, brake condition. Begin parts inventory tracking.
Month 5: Analyze 90 days of maintenance data. Identify labor bottlenecks. Implement wrench time improvement initiatives. Batch similar work orders. Pre-stage parts.
Month 6: Full PM compliance data available. Adjust PM schedules based on actual vehicle performance. Review cost per mile by vehicle. Identify vehicles with accelerating costs.
Expected Savings Month 6: $25,000-$45,000 cumulative (preventive improvements + labor efficiency + predictive maintenance catches)
Month 7: Complete parts usage analysis. Identify highest-cost parts categories. Begin vendor consolidation negotiations.
Month 8: Implement vendor contracts with volume discounts. Transition to smaller number of preferred suppliers. Reduce duplicate part numbers and SKU complexity.
Month 9: Transition to JIT ordering for high-volume parts. Monitor inventory carrying costs. Measure improvement in parts cost per mile.
Expected Savings Month 9: $35,000-$65,000 cumulative (parts discounts, inventory optimization, waste reduction)
Month 10: 12-month cost data complete. Calculate year-over-year improvements. Document savings by category: preventive maintenance, labor efficiency, parts optimization.
Month 11: Vehicle retirement analysis. Identify candidates for replacement based on cost per mile exceeding threshold. Plan next year's replacement schedule.
Month 12: Annual budget review using real data instead of historical estimates. Plan year two optimization: advanced predictive maintenance, condition-based service intervals, electric bus transition planning.
Expected Savings Month 12: $65,000-$120,000+ cumulative (25-35% cost reduction documented)
Calculate Your Fleet's Specific Cost Reduction Potential
Get a personalized cost analysis showing current maintenance spending, benchmarks for similar fleets, and your specific savings opportunity. Free assessment takes 15 minutes.
Cost Reduction by Fleet Type and Region
Key cost drivers: Winter weather increases salt damage and braking wear. Older fleet average age 9 years. High labor costs ($48-52/hr). Opportunity: Preventive maintenance, parts consolidation, vehicle replacement cycle.
Key cost drivers: High-mileage use (transit buses run 150-200K miles annually). Extreme temperature variation (desert heat causes cooling system failures). Opportunity: Predictive maintenance for transmission and cooling systems, condition-based service intervals.
Key cost drivers: Highway use (transmission and suspension wear). Summer AC overuse. Operator variability (different drivers, different maintenance practices). Opportunity: Driver behavior monitoring, PM compliance tracking, labor efficiency improvement.
Key cost drivers: Stop-and-go city driving (brake wear is extreme, 2-3x highway rate). Electric bus transition adds complexity (mixed diesel and EV fleet). Opportunity: Brake monitoring predictive maintenance, EV-specific PM scheduling, route optimization.
Key cost drivers: Seasonal usage (buses idle 3+ months in summer). Cold weather diesel gelling and battery drain. Newer average fleet age (7 years). Opportunity: Seasonal storage optimization, cold weather PM adaptations, parts consolidation.
Key cost drivers: Mixed vehicle types, variable fuel prices, aging fleet. Scattered maintenance practices. Opportunity: Standardized PM scheduling, consolidated parts vendors, predictive maintenance implementation.
Frequently Asked Questions About Cost Reduction Strategies
How quickly can we achieve 30% cost reduction?
Is cost reduction achievable without technology (CMMS)?
Which strategies generate fastest payback?
What if we have a very old fleet? Can we still achieve 30% reduction?
Do we need perfect data to start cost reduction initiatives?
How do we handle staff resistance to cost reduction initiatives?
Can cost reduction co-exist with safety improvements?
Real Fleet Case Studies: Documented 30%+ Cost Reductions
Baseline: $1,400,000 annual maintenance (50 buses × $28,000). Cost per mile: $0.62. Reactive maintenance dominant (65% reactive). Downtime: 12 buses down daily.
Intervention: CMMS implementation, PM scheduling, PM compliance tracking, driver safety monitoring, parts consolidation (4 vendors → 2 vendors).
Year 1 Results: Maintenance cost reduced to $980,000 (-$420,000, -30%). Cost per mile: $0.43. PM compliance: 96%. Downtime: 3 buses down daily. Safety incidents: 35% reduction.
ROI: Year 1 savings of $420,000 vs. $12,000 CMMS cost = $408,000 net benefit, 3,400% ROI.
Baseline: $3,840,000 annual maintenance (120 buses × $32,000). Mixed fleet: 80 diesel, 40 CNG. Cost per mile: $0.68. Compliance audits identify gaps annually.
Intervention: CMMS with fuel-type PM scheduling, telematics integration, predictive maintenance, automated compliance reporting.
Year 1 Results: Maintenance reduced to $2,688,000 (-$1,152,000, -30%). Cost per mile: $0.44. PM compliance: 98%. Compliance audit: zero findings. Prevented 8 predicted transmission failures through predictive alerts.
ROI: Year 1 savings of $1,152,000 vs. $48,000 CMMS cost = $1,104,000 net benefit, 2,300% ROI.
Baseline: $840,000 annual maintenance (35 buses × $24,000). Spreadsheet-based tracking. Multiple vendors. No cost per mile visibility.
Intervention: CMMS, driver safety monitoring, labor efficiency improvements, parts vendor consolidation, condition-based brake service.
Year 1 Results: Maintenance reduced to $588,000 (-$252,000, -30%). Cost per mile: $0.38. Operator per-mile cost visibility enabled route profitability analysis. Accident rate: 42% reduction through safety coaching.
ROI: Year 1 savings of $252,000 vs. $8,400 CMMS cost = $243,600 net benefit, 2,900% ROI.
We thought 30% cost reduction was a pie-in-the-sky goal. After implementing BusCMMS and following their cost reduction roadmap, we hit 28% reduction in year one and 33% by year two after vehicle retirement analysis. The CMMS not only paid for itself but freed up $280,000 in annual budget that we redirected to driver raises and facility improvements. Our technician retention improved dramatically because they're working on well-maintained buses instead of reactive emergencies.
Conclusion: Cost Reduction Is Systematic, Not Mysterious
Fleet managers often treat high maintenance costs as inevitable. "That's just what buses cost." In reality, cost variance between average and best-in-class fleets is 25-35% and fully explainable: preventive vs. reactive maintenance mix, PM compliance rate, labor efficiency, parts inventory management, and vehicle age distribution. Each factor is independently addressable. None require cutting maintenance quality or skipping safety items. All involve optimizing existing spending. Start with quick wins (PM compliance tracking, labor efficiency improvements), move to medium-term optimization (parts consolidation, vendor negotiations), and scale to long-term strategy (vehicle replacement planning, condition-based service intervals). A 30% cost reduction is not just possible; it's the documented median result for fleets implementing systematic CMMS-driven optimization. The question isn't whether cost reduction is achievable. It's whether your fleet will be the one that captures this opportunity or the one that watches competitors implement it first. Visit buscmms.com to calculate your specific cost reduction potential, request an assessment, or schedule a demo showing how documented cost improvements translate to your fleet.
Start Your Fleet's Cost Reduction Journey
Get your personalized cost analysis, benchmark report, and implementation roadmap. See exactly where your fleet can cut costs without cutting corners.