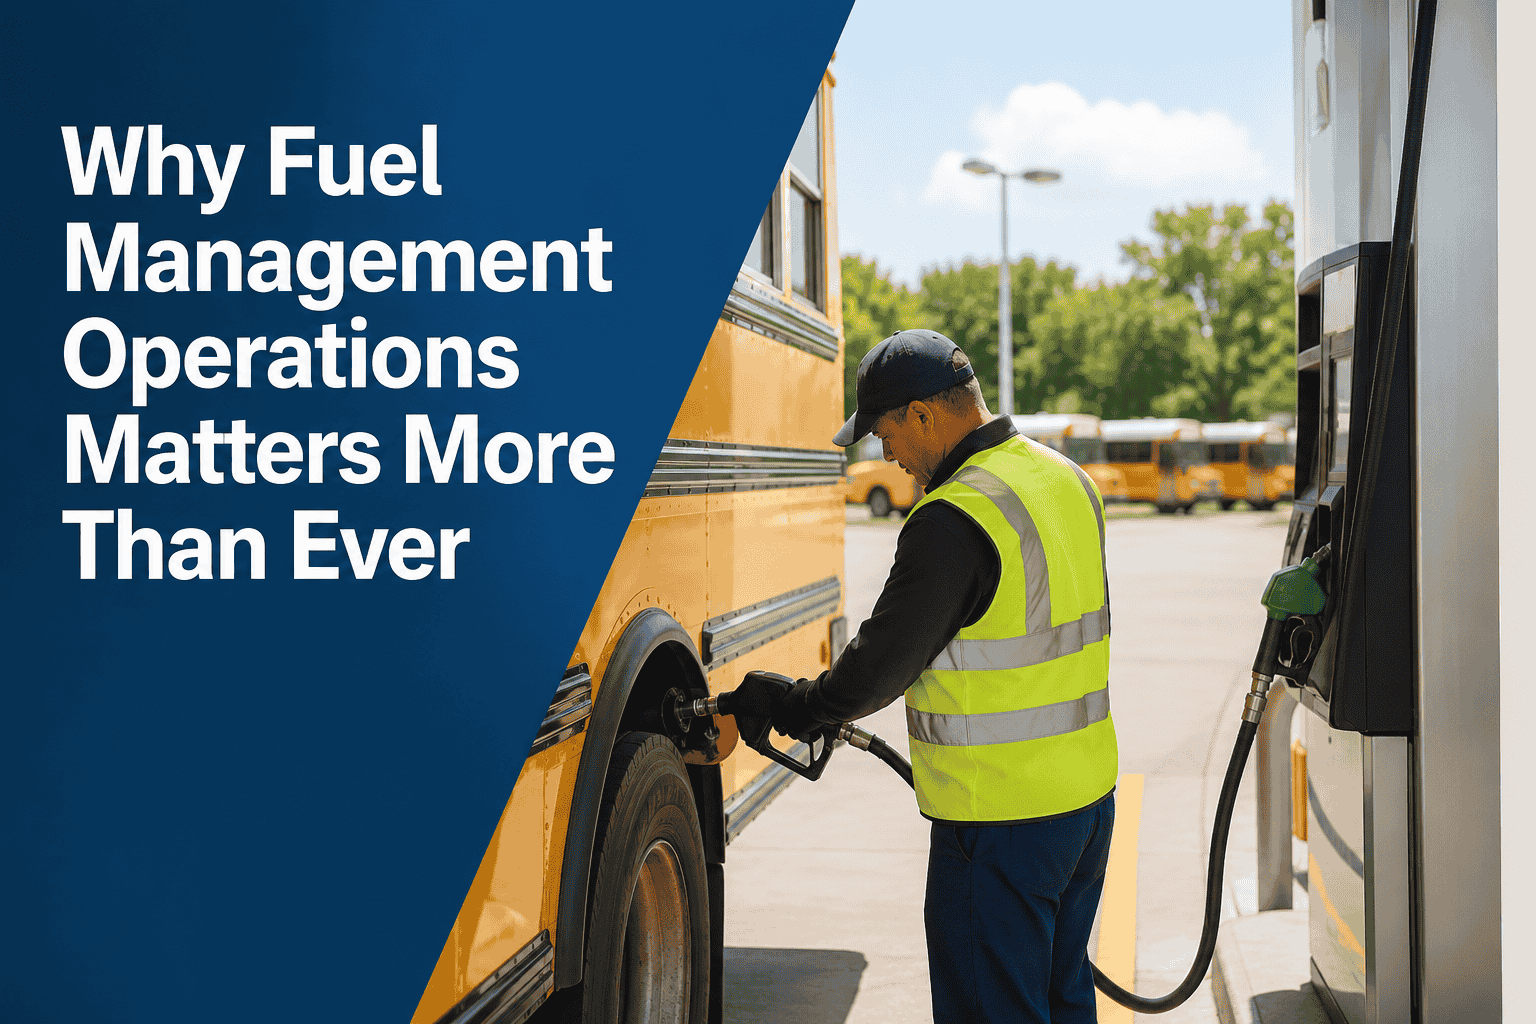
A school bus fleet of 85 vehicles spent $340,000 annually on fuel without tracking consumption by vehicle. They knew total cost but couldn't identify which buses were fuel hogs. One bus was averaging 4.2 MPG while the fleet average was 5.8 MPG. That single bus was costing $18,000 extra per year. Without fuel management operations tracking consumption per vehicle, that waste stayed invisible for three years. When they finally implemented fuel tracking linked to maintenance records, they discovered the problem bus had a clogged fuel injector — a $200 fix that saved $18,000 annually. Fuel management isn't just about cost control. It's about operational visibility. When you can see fuel consumption per mile, per route, and per vehicle, you can identify mechanical problems, optimize routing, and prove efficiency to stakeholders. Here's how transit and school bus fleets build fuel management operations that pay for themselves within months.
Why Fuel Management Operations Matters More Than Ever
Track fuel per vehicle. Identify inefficiencies. Link fuel data to maintenance. Save 10–20% annually.
Most fleets view fuel as a cost line item: spend money, buy fuel, burn through budget. Fleets that manage fuel see it as diagnostic data: changes in consumption signal mechanical problems. A bus dropping from 5.8 MPG to 4.9 MPG isn't just costing more per mile. It's telling you something is wrong. Possible causes: clogged air filter (restricts airflow), worn fuel injectors (poor combustion efficiency), low tire pressure (increases rolling resistance), transmission slipping (inefficient power transfer), or engine timing problems (combustion inefficiency). Without fuel tracking, you wouldn't know. With it, you can trigger diagnostics and fix problems before they become breakdowns. Fuel management operations link fuel consumption data to maintenance records and create alerts when consumption deviates from baseline. This turns fuel from a cost center into a maintenance diagnostic system.
Fuel management operations require three components working together. First: fuel card integration. Daily fuel transactions automatically sync consumption by vehicle. Second: baseline establishment. Calculate expected MPG for each vehicle type by route, season, and conditions. Third: automated alerting. When a vehicle deviates 10–15% from baseline, trigger an alert and auto-create a diagnostic work order. A bus normally consuming 35 gallons per day across its routes is now consuming 41 gallons. Alert fires. Mechanic investigates. Problem found: air filter hasn't been changed in 18 months despite PM schedule. Fix applied. Fuel consumption returns to 35 gallons. Simple system, massive impact. Most fleets lack this because fuel cards and CMMS don't talk to each other. Integration requires a CMMS that accepts fuel data imports and can trigger maintenance based on consumption anomalies.
A transit authority with 140 buses implemented fuel tracking in January. By month three they'd identified 12 vehicles consuming 18–25% more fuel than baseline. Investigation found: 4 vehicles with clogged air filters, 3 with worn fuel injectors, 2 with low tire pressure, 2 with transmission problems, and 1 with engine timing issues. Fixes cost $4,200 total. Fuel savings: $68,000 annually. A school district with 95 buses used fuel data to optimize routes. By analyzing consumption per route, they identified three routes with poor fuel efficiency. Route redesign saved $22,000 per year in fuel. Another fleet used fuel data to identify driver behavior problems. Two drivers were consistently 12–15% worse than their peers on identical routes. Training improved their fuel efficiency by 8–10%, saving another $14,000 annually. All three examples share a pattern: fuel data revealed problems, maintenance or operational changes fixed them, and savings paid back the system investment 20–100x over.
Fuel management operations don't require massive technology investment. Start with three steps: integrate your fuel card data into a spreadsheet or CMMS that accepts imports (most major card providers offer this). Calculate baseline MPG for each vehicle type. Set alerts for 10–15% deviations. Month one: collect baseline data. Month two: identify anomalies. Month three: fix problems. By month four, fuel savings should cover the system cost. Most fleets see payback within 90 days and 10–20% annual fuel savings thereafter. The barrier isn't technology. It's integration. Your fuel card company has the data. Your CMMS needs to accept it. Getting those two systems talking is the key.
Fuel management operations transform fuel from a cost line item into a diagnostic and efficiency tool. By tracking consumption per vehicle, per route, and per driver, fleets identify mechanical problems, route inefficiencies, and driver behavior issues — all before they become expensive breakdowns. Integration between fuel card systems and CMMS enables automated alerts when consumption deviates from baseline, triggering maintenance diagnostics that fix problems for $200–$800 and save $12K–$50K annually per vehicle. Most fleets achieve ROI within 90 days and 10–20% annual fuel savings thereafter. Fuel management operations aren't optional — they're the easiest way to improve fleet efficiency and prove operational discipline to stakeholders. BusCMMS integrates fuel card data automatically, calculates baselines, alerts on anomalies, and triggers maintenance work orders all in one system.







