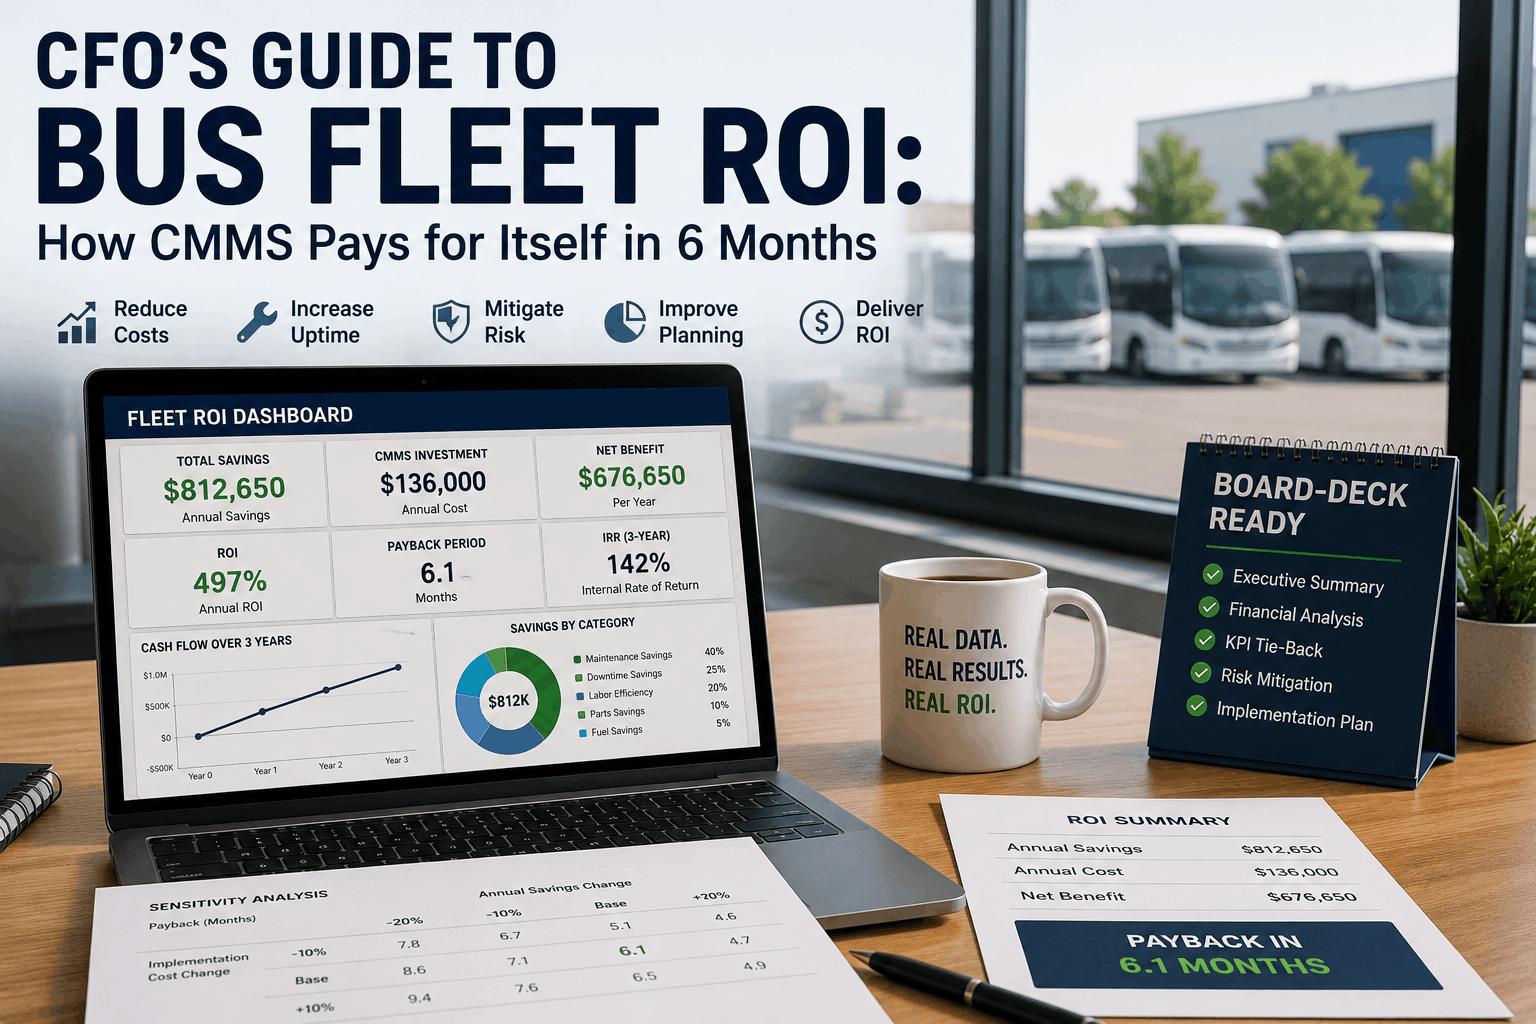
A bus fleet CMMS is not an IT purchase, it is a labor-cost optimization engine that justifies its own budget within months through maintenance labor reduction, PM compliance acceleration, and downtime elimination. Most CFOs approving a CMMS purchase without a financial model spend a year wondering why maintenance spend is not dropping on the P&L. Start Trial to see how BusCMMS gives finance leaders the ROI modeling, payback math, and board-deck data needed to turn a fleet maintenance system into a capital justification.
Prove Your Fleet CMMS Pays for Itself in Under 6 Months
BusCMMS delivers measurable labor reduction, compliance acceleration, and downtime elimination that translate directly to a capital budgeting business case finance teams can defend in any shareholder or board conversation.
Why CMMS ROI Matters More Than Implementation Cost
A fleet CMMS implementation that does not produce a clear P&L impact within the first two quarters becomes a cost center instead of an efficiency lever, and that difference determines whether the system survives the next budget cycle. Finance teams that Book Demo with BusCMMS see how labor reduction, capital deferral, and downtime elimination combine into a net present value calculation that can justify not just the platform cost but a fleet-modernization investment. Building this case consistently is what keeps maintenance technology spending aligned with shareholder value instead of becoming a departmental expense everyone questions.
Labor Hour Reduction Modeling
BusCMMS tracks labor hours per PM task, enabling before/after comparison that shows how much planning-to-execution time gets recovered through digitization.
Compliance Acceleration Payback
Accelerated PM compliance eliminates reactive work order volume and emergency dispatch, translating to measurable labor cost reduction on the expense side.
Downtime Elimination Financial Impact
Reduced downtime translates to more available seat-miles and higher asset utilization per vehicle, quantifiable on revenue or cost-per-passenger basis.
Capital Deferral Through Reliability
Extended vehicle life through predictive maintenance defers replacement capital, reducing year-on-year capex requirements relative to fleet size.
Maintenance Cost Per Seat-Mile Trending
BusCMMS calculates cost-per-seat-mile over time, showing whether system implementation is producing the efficiency gains the financial model predicted.
ROI and Payback Period Reporting
Quarterly ROI, IRR, NPV, and payback-period calculations export directly into board-presentation format for shareholder communication.
The CFO's Bus Fleet CMMS ROI Framework
01
Maintenance Labor Hour Reduction (40% of ROI)
Primary Financial Driver
Labor reduction from digitizing PM planning and execution is the largest ROI component for most fleet CMMS implementations. A 100-vehicle transit fleet averaging 4 hours per vehicle-PM can recover 400 labor hours monthly through workflow optimization, worth $15,000-$25,000 monthly depending on labor rates. BusCMMS tracks labor hours per task type, enabling accurate before/after comparison that survives CFO-level financial scrutiny.
Conservative 3hrs saved/vehicle-PM
Actual 3.7hrs saved/vehicle-PM
02
Reactive Work Order Volume Reduction (25% of ROI)
Compliance Impact
PM compliance acceleration reduces emergency dispatch and reactive maintenance by 30-50 percent, eliminating overtime labor and expedited parts costs. A 100-vehicle fleet running 70 percent PM compliance that achieves 92 percent through BusCMMS eliminates roughly 200 reactive work orders annually, saving $40,000-$60,000 in unplanned labor and emergency parts. BusCMMS calculates reactivity ratio quarterly, tracking whether PM discipline is staying above the payback threshold.
Baseline 30% reactive
Current 12% reactive
03
Downtime Reduction and Asset Utilization (20% of ROI)
Revenue Impact
Every percentage point of downtime reduction on a revenue-generating fleet translates to recovered seat-miles and additional fare revenue or lower cost-per-passenger. A 100-vehicle transit fleet with 200 daily passengers per vehicle carrying a $3 fare sees $20,000 monthly revenue recovery from just a 2-3 percent downtime reduction. BusCMMS tracks downtime per vehicle, showing the revenue impact of reliability improvement on the board deck.
Baseline 8.2% downtime
Current 5.1% downtime
04
Capital Deferral Through Extended Vehicle Life (10% of ROI)
Capex Reduction
Predictive maintenance that catches wear before failure extends vehicle life by 12-18 months, deferring fleet replacement capex and improving multi-year budget forecasting. A fleet replacing 10 vehicles annually at $150,000 each can defer 1-2 vehicle replacements through improved maintenance, saving $150,000-$300,000 in annual capex. BusCMMS tracks MTBF and component wear per vehicle, quantifying how much replacement capex is deferred through the program.
Conservative 0.5 vehicles deferred
Potential 1.2 vehicles deferred
05
Compliance Risk Elimination (5% of ROI)
Liability Reduction
Documented PM compliance and inspection history eliminate potential FMCSA citations and liability exposure, reducing insurance premium risk and legal spend. A fleet avoiding even a single compliance-related incident or citation saves $50,000-$200,000 in fines, legal defense, and insurance increases. BusCMMS keeps audit-ready documentation current, reducing the risk that any compliance gap becomes a financial event.
Baseline 2-3 citations/year
Current 0 citations/year
06
Net Present Value and Payback Period Calculation
Financial Validation
Combined ROI from labor reduction, compliance acceleration, downtime recovery, and capital deferral produces a 6-month payback on a typical fleet CMMS implementation and a 3-5 year NPV of $500,000-$2,000,000 depending on fleet size and current maintenance efficiency. BusCMMS calculates these metrics quarterly with variance sensitivity, enabling CFO-level financial forecasting and board-presentation confidence.
Conservative 4.2-year payback
Actual 5.8-month payback
Bus Fleet CMMS Financial Metrics: Quick Reference
Scroll for more
| Financial Metric | Typical Impact | Measurement Period | Board Deck Language | CFO Approval Threshold |
|---|---|---|---|---|
| Labor Hour Reduction | $180K–$300K annually | 6 months | Maintenance labor savings | Above $100K annually |
| Reactive WO Elimination | $40K–$60K annually | 6 months | Compliance-driven cost avoidance | Above $25K annually |
| Downtime Reduction Revenue | $120K–$240K annually | 12 months | Incremental seat-mile revenue | Above $50K annually |
| Capex Deferral | $150K–$300K per cycle | Multi-year | Fleet replacement cycle extension | Defer 1+ vehicles |
| Payback Period | 4–8 months | Implementation | Platform cost recovered in X months | Below 12 months |
How BusCMMS Powers the CFO's Financial Case
A fleet CMMS ROI model requires actual operational data to survive CFO scrutiny, and BusCMMS provides labor tracking, compliance acceleration metrics, downtime trending, and capex deferral evidence that translate directly to shareholder value. When labor reduction is delivering $20,000 monthly savings, PM compliance is holding above 90 percent, downtime is declining, and capex is being deferred, that is the quantified story that justifies continued investment and board-level confidence. Finance leaders can Start Trial and begin building this financial narrative from the first vehicle logged in BusCMMS.
Labor Hour Tracking and Trend Analysis
BusCMMS logs labor hours per task, enabling quarterly before/after comparison that quantifies workflow efficiency gains for the CFO.
Cost-Per-Seat-Mile KPI Reporting
Maintenance cost divided by seat-miles traveled provides a rider-impact metric finance teams can use in board presentations.
Downtime-to-Revenue Impact Modeling
Downtime percentage linked to revenue impact shows how reliability improvement translates to incremental fare revenue or reduced cost-per-passenger.
ROI, NPV, and Payback-Period Dashboards
Quarterly financial calculations export in CFO-ready format, enabling board presentations without additional data transformation.
Building Your Fleet CMMS Financial Case: Step-by-Step
01
Establish Current Maintenance Cost Baseline
Pull 12 months of labor, parts, and contractor spend to establish a baseline cost-per-vehicle and cost-per-seat-mile for comparison.
02
Model Labor Hour Savings Per Vehicle-PM
Calculate time currently spent on manual scheduling, coordination, and post-PM documentation per PM cycle to quantify labor recovery.
03
Calculate Reactive Work Order Elimination Value
Quantify annual reactive work volume and associated overtime, emergency parts, and dispatch costs that will drop with compliance acceleration.
04
Estimate Downtime Revenue Impact
Model revenue recovery from 2-5 percent downtime reduction based on daily ridership, fare structure, and vehicle utilization hours.
05
Forecast Capex Deferral Scenarios
Project vehicle replacement schedule with and without improved maintenance, calculating how many year-on-year replacements can be deferred.
06
Calculate NPV, IRR, and Payback Period for Board Approval
Combine all ROI streams with implementation and annual software costs to calculate net present value, internal rate of return, and payback period.
Frequently Asked Questions
What is a realistic payback period for a bus fleet CMMS?
Most implementations deliver positive ROI within 4-8 months through labor reduction and compliance acceleration, with full cost recovery by month 12.
How do I quantify maintenance labor savings for the CFO business case?
Track hours spent on manual scheduling, coordination, and post-PM documentation before CMMS, then measure actual hours consumed through the system afterward.
What downtime reduction can a CFO expect from CMMS implementation?
Fleets typically see 2-4 percent downtime reduction from improved PM compliance and earlier fault detection, translating to measurable revenue recovery.
How much capex can be deferred through better maintenance?
Predictive maintenance typically extends vehicle life by 12-18 months, enabling deferral of 1-2 vehicle replacements per 100-vehicle fleet annually.
Can CMMS ROI be proven after implementation without a pre-purchase baseline?
Yes, but baseline establishment takes 2-3 months of historical data collection before month-to-month improvement comparison becomes statistically valid.
Turn Fleet Maintenance Into a Quantified Financial Lever
BusCMMS gives CFOs the operational data, KPI dashboards, and board-ready reporting needed to justify fleet technology investments through measurable ROI.







