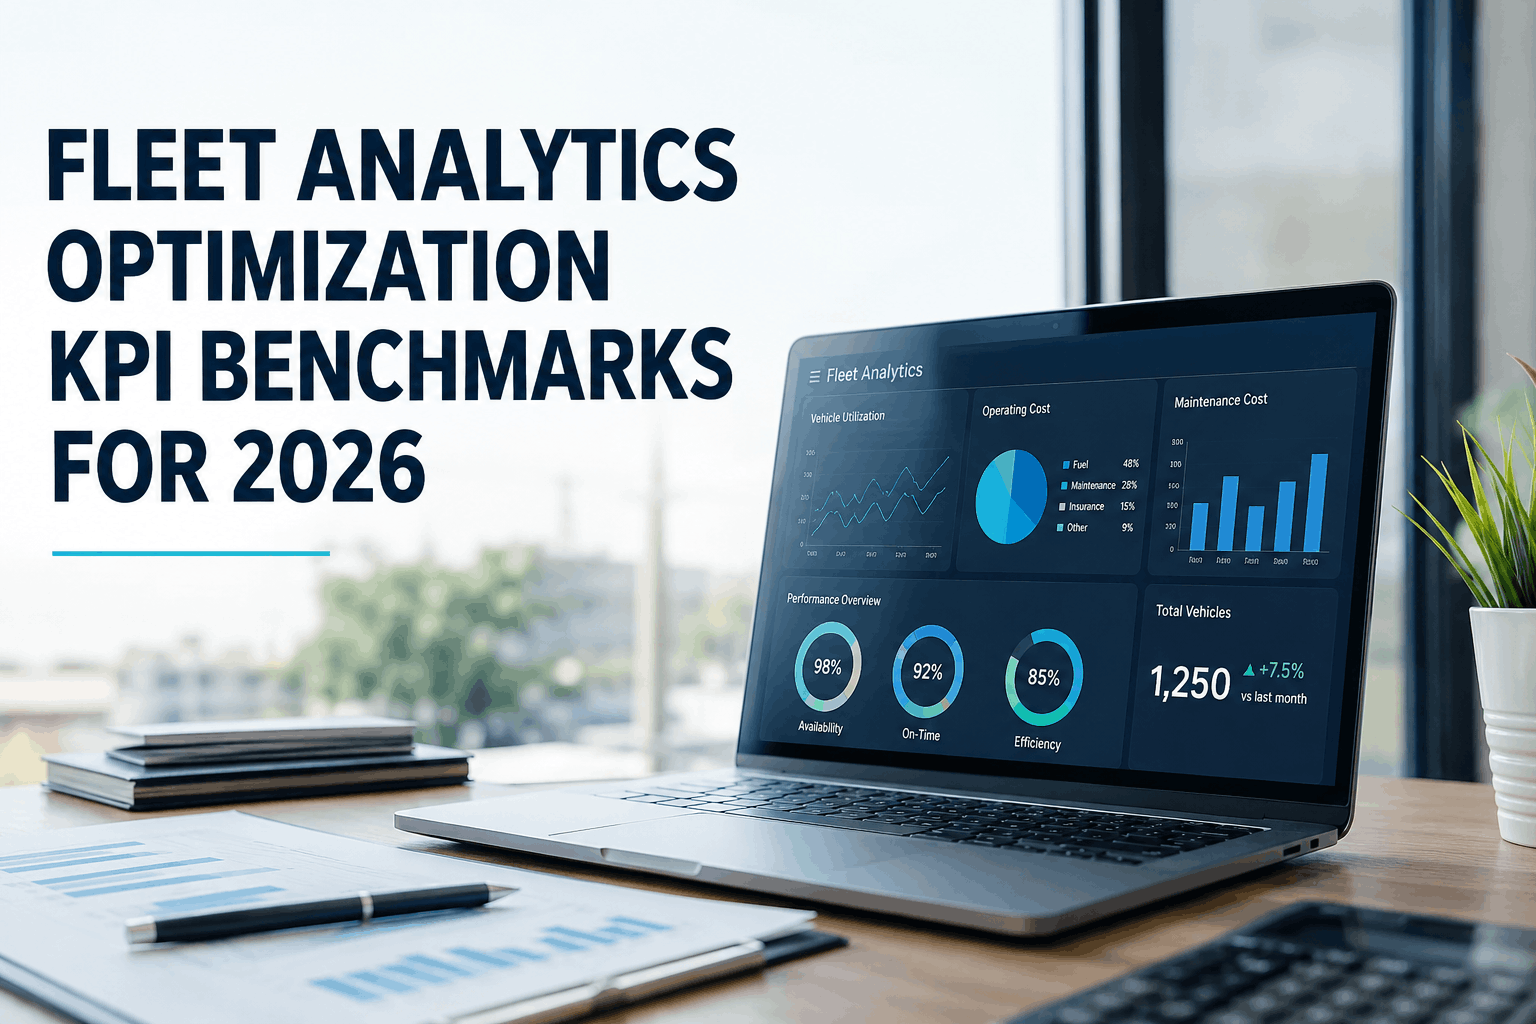
A public transit agency operating 180 buses struggled with conflicting performance reports. Maintenance reported one availability number. Operations reported another. Finance calculated cost per mile differently from both. The leadership team couldn't agree on whether the fleet was improving or declining. After implementing a standardized fleet analytics optimization framework, they aligned all departments around the same KPIs: preventive maintenance compliance, mean time between failures, fleet availability rate, and cost per mile. Within six months, the agency reduced unplanned downtime by 45%, lowered maintenance cost per mile by 18%, and passed their FTA triennial audit with zero findings. Fleet analytics optimization isn't about tracking more numbers — it's about tracking the right numbers consistently. Here is how leading fleets manage analytical benchmarks to drive measurable improvement in 2026.
Fleet Analytics Optimization KPI Benchmarks for 2026
Discover how leading fleets manage fleet analytics optimization using data, automation, and standardized operating procedures.
Most fleet analytics failures start with inconsistent definitions. One manager calculates PM compliance as completed PMs divided by scheduled PMs. Another includes only safety-critical PMs. A third uses a different time window. The numbers don't match. No one knows if the fleet is improving. Standardized KPI benchmarks solve this by defining exactly how each metric is calculated, what data sources are used, and how often it's measured. For 2026, leading fleets have aligned around seven essential benchmarks: Preventive Maintenance Compliance (target 90%+), Mean Time Between Failures (target 2,000+ hours for transit, 1,500+ for school), Fleet Availability Rate (target 92%+), Cost Per Mile (target $1.20-1.50 for transit, $0.90-1.20 for school), Unscheduled Breakdown Rate (target under 2 per 100k miles), Parts Inventory Turnover (target 4-8 turns annually), and Technician Productivity (target 75%+ utilization).
Leading fleets have aligned around seven core benchmarks that provide complete visibility into fleet health. Each benchmark has a clear calculation method, target range, and data source.
A 200-bus transit agency used standardized benchmarks to identify that their PM compliance was 74% — well below the 90% target. The analytics dashboard showed that 60% of missed PMs were due to parts shortages. They adjusted inventory reorder points and parts availability improved from 68% to 94%. PM compliance rose to 92% within four months. Breakdowns dropped 52%. A school district found that their fleet availability was 79% — 13 points below target. The analytics revealed that 35% of downtime was caused by repeat defects on the same 12 buses. They replaced those buses and availability improved to 91% in six months. Analytics doesn't just show problems — it shows which problems to solve first.
Implementing fleet analytics optimization doesn't require a complete operational overhaul. A phased approach minimizes disruption. Phase 1 (Month 1): Standardize KPI definitions across all departments. Establish baseline metrics for all seven benchmarks. Phase 2 (Months 2-3): Implement centralized data collection. Connect fuel cards, telematics, work orders, and parts inventory to a single CMMS. Phase 3 (Months 4-6): Configure automated dashboards and exception alerts. Train staff on interpreting analytics. Phase 4 (Months 7-12): Use analytics to drive operational changes. Adjust PM schedules, inventory levels, and technician assignments based on data. Track improvement monthly.
Fleet analytics optimization transforms operational data into strategic insight. The seven essential benchmarks for 2026 — PM compliance, fleet availability, MTBF, cost per mile, breakdown rate, parts turnover, and technician utilization — provide complete visibility into fleet health. Standardized definitions ensure all departments measure success the same way. Leading fleets use analytics to identify root causes, prioritize investments, and track improvement over time. A 180-bus transit fleet typically reduces operating costs 12-18% within 12 months of implementing standardized analytics. BusCMMS provides the centralized platform needed to track all seven benchmarks, configure automated alerts, and generate leadership-ready reports. Start with standardized definitions. Add centralized data. Build dashboards. Drive improvement.







