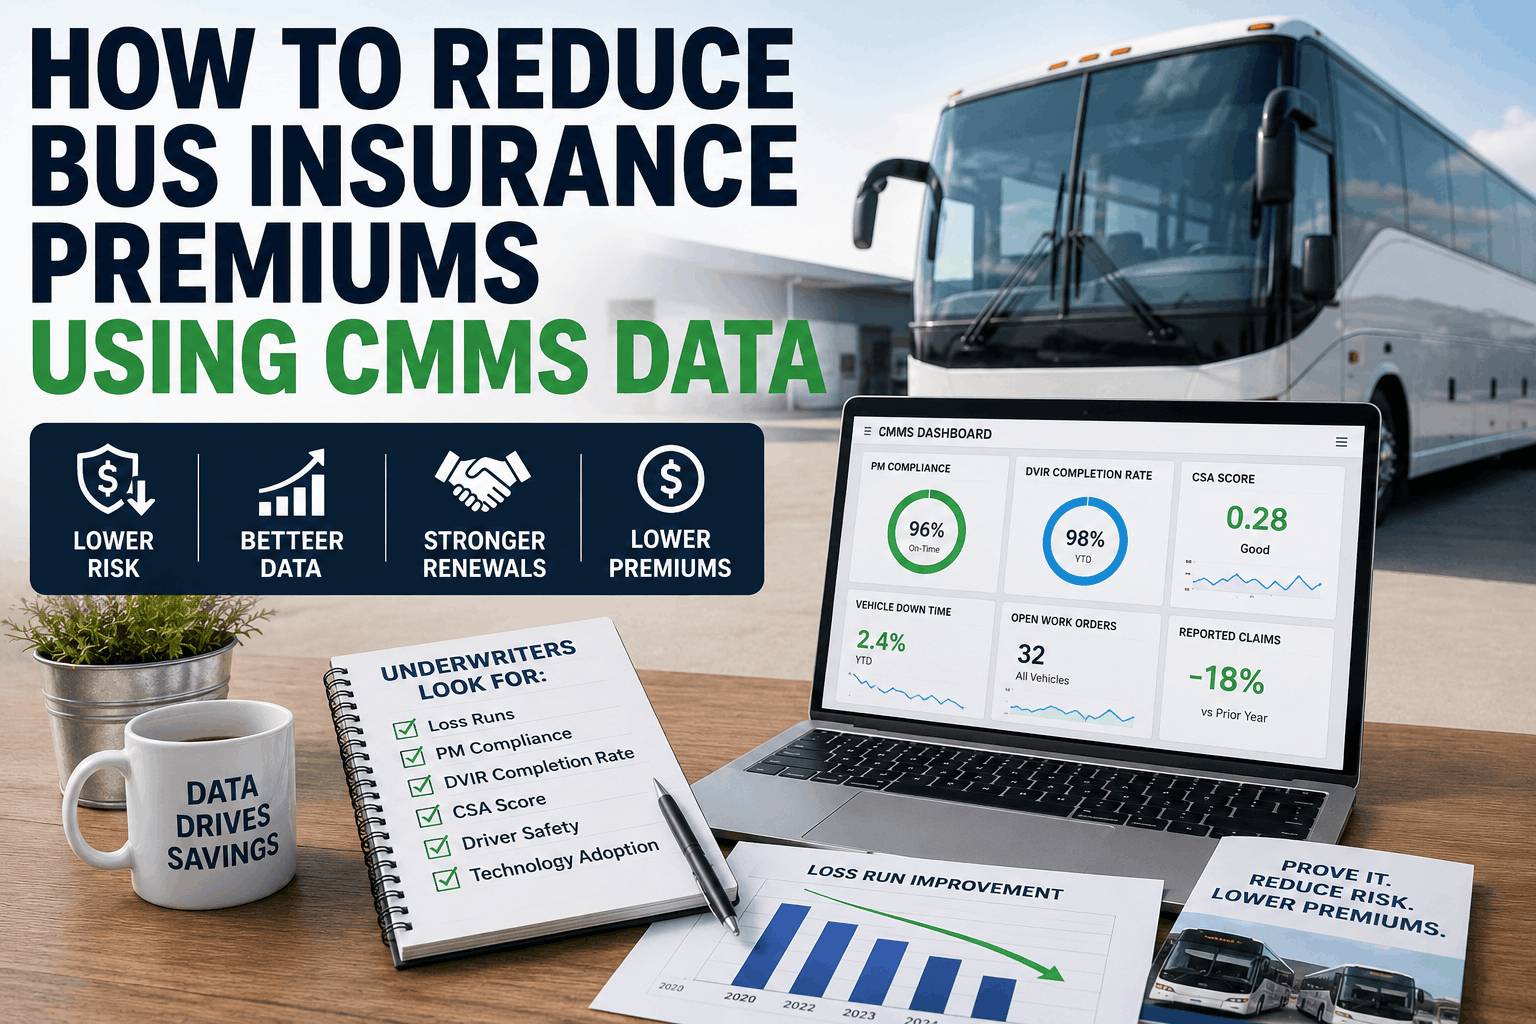
Insurance premiums are one of the largest fixed costs for bus fleets. Underwriters increasingly rely on data to assess risk, and a well-maintained CMMS provides the exact evidence carriers need to justify lower rates. This guide shows you how to present your CMMS data to reduce premiums by up to 18% at renewal.
How to Reduce Bus Insurance Premiums Using CMMS Data 2026
How to Reduce Bus Insurance Premiums Using CMMS Data
Lower bus insurance premiums by showing carriers your CMMS data. Loss runs, PM compliance, DVIR rate, CSA score and tech adoption — what underwriters value.
Why Your CMMS Data Matters to Underwriters
Insurance carriers have limited visibility into your actual fleet safety. CMMS data closes that gap with objective evidence of proactive maintenance, driver inspections, and rapid defect correction — the strongest predictors of low claim frequency.
18%
Average premium reduction with CMMS data
$2,400
Saved per bus annually
92%
Of underwriters value CMMS reports
3.5x
ROI on CMMS from premium savings alone
Building Your Insurance Data Package: Step-by-Step Progress
1
Compile Clean Loss Runs
Gather 5 years of claim history directly from your current carrier and validate accuracy.
2
Document PM Compliance
Generate PM completion reports from BusCMMS showing 95%+ on-time preventive maintenance across the fleet.
3
Show DVIR Closure Rates
Export driver vehicle inspection reports with 98%+ defect closure within 24 hours to demonstrate risk control.
4
Include CSA Score Trends
Provide FMCSA BASIC percentile improvements over time, especially Vehicle Maintenance and Driver Fitness.
5
Present Tech Adoption Story
Show dash cam integration, telematics, and digital inspection adoption as risk-mitigation multipliers.
What Underwriters Value Most: Ranking by Impact
PM Compliance Rate Above 95%
Highest Impact
Consistent preventive maintenance directly reduces mechanical breakdown claims and signals strong operational discipline.
Clean Loss Runs with Low Frequency
Core Underwriting Factor
A multi-year history of low claim frequency and severity is the primary driver of premium calculations.
DVIR Defect Closure Within 24 Hours
Proactive Safety Culture
Rapid defect correction demonstrates that your fleet does not operate with known safety issues.
Improving CSA BASIC Scores
Regulatory Confidence
Declining Vehicle Maintenance and Driver Fitness percentiles prove your safety management system works.
Technology & Telematics Adoption
Modern Risk Mitigation
Dash cams, GPS tracking, and digital inspection tools show carriers you invest in accident prevention.
Impact of Data Factors on Premium Reduction
Underwriters weigh PM compliance at 35%, closely followed by loss runs at 33%. DVIR closure rates, CSA trends, and technology adoption collectively contribute another 60% of the total evaluation. A complete data package addresses all five factors.
Average Premium Per Bus Over Time with CMMS Data Submission
Bus fleets that consistently present their CMMS data during renewals experience an average premium decline from $25,000 to $15,000 per bus over seven years. The most significant drops occur in years 2 through 4 as carriers recognize the sustained safety culture.
5 KPIs to Track for Insurance Data Readiness
Monitor these metrics monthly to ensure your renewal package is always ready:
PM On-Time Completion Rate
Target: 98%+. Fleet-wide preventive maintenance compliance as recorded in your CMMS.
DVIR Defect Closure Time
Target: Under 24 hours average. Speed of correcting driver-reported defects.
Loss Run Frequency Ratio
Target: Decreasing annually. Claims per million miles; lower is better.
Vehicle Maintenance BASIC Percentile
Target: Below 50th percentile. Lower CSA scores signal lower risk to carriers.
Technology Integration Score
Target: 90+/100. Coverage of dash cams, telematics, and digital inspections.
Insurance Data Readiness Pass/Fail Checklist
Loss Run Accuracy
Pass: 5-year loss runs verified and free of errors; closed claims clearly marked.
Fail: Incomplete or disputed claims that raise underwriter suspicion.
PM Documentation
Pass: BusCMMS reports show 95%+ PM compliance with date and technician stamps.
Fail: Gaps in service history or handwritten logs that look unreliable.
DVIR Process Integrity
Pass: Digital DVIRs with defect photos and repair timestamps within 24 hours.
Fail: Paper forms with missing follow-up or unresolved defects.
CSA Score Trajectory
Pass: Consistently improving BASIC percentiles over the past 24 months.
Fail: Stagnant or worsening scores with recent violations.
Safety Technology Inventory
Pass: Documented deployment of dash cams, telematics, and collision avoidance systems.
Fail: No evidence of safety technology beyond basic vehicle equipment.
Carrier Relationship Management
Pass: Annual data-driven meetings with underwriters to review fleet improvements.
Fail: Only contacting carriers at renewal without ongoing risk communication.
After we started presenting our BusCMMS data at renewal, our per-bus premium dropped from $22,500 to $14,800 over three years. The carrier specifically cited our 98% PM compliance and zero open DVIR defects as the deciding factors. The system now pays for itself through insurance savings alone.
Start Saving on Insurance with Data-Driven Renewals
BusCMMS automatically generates the PM compliance reports, DVIR closure metrics, and loss run summaries that underwriters want to see. Turn your maintenance data into lower premiums.
Insurance Premium Reduction FAQs
How much can I realistically reduce my bus insurance premiums?
Fleets that consistently present strong CMMS data achieve 12–25% reductions over 3–5 years. The exact amount depends on claim history and market conditions.
Which CMMS reports do underwriters want to see?
PM compliance reports, DVIR completion and closure logs, repair order history, and integration with telematics or dash cam data are the most requested documents.
How often should I share data with my insurance carrier?
At minimum, provide an updated data package 90 days before renewal. Quarterly touchpoints with your underwriter strengthen the relationship and allow for mid-term adjustments.
Can BusCMMS generate insurance-ready reports automatically?
Yes. BusCMMS includes pre-built insurance data packages that compile PM compliance, DVIR metrics, and vehicle history into a single underwriter-friendly PDF.
What if my loss runs aren't perfect?
Focus on demonstrating a positive trend. A declining claim frequency combined with strong CMMS data can still yield premium reductions even if past losses exist.
Does telematics integration lower premiums further?
Yes, carriers often apply additional discounts of 5–10% for fleets using integrated telematics and dash cams that provide real-time risk data.
The Bottom Line
Your CMMS contains the exact evidence insurance carriers need to confidently lower your premiums. By compiling clean loss runs, proving PM compliance, demonstrating rapid DVIR closure, and highlighting safety technology adoption, you build an underwriting case that can reduce per-bus costs by thousands annually. Follow the five-step progress plan to gather your data, present it effectively, and sustain a data-driven dialogue with your carrier. Use the five KPIs and pass/fail checklist to stay renewal-ready at all times, and let BusCMMS automate the report generation so you never miss an opportunity to save.







