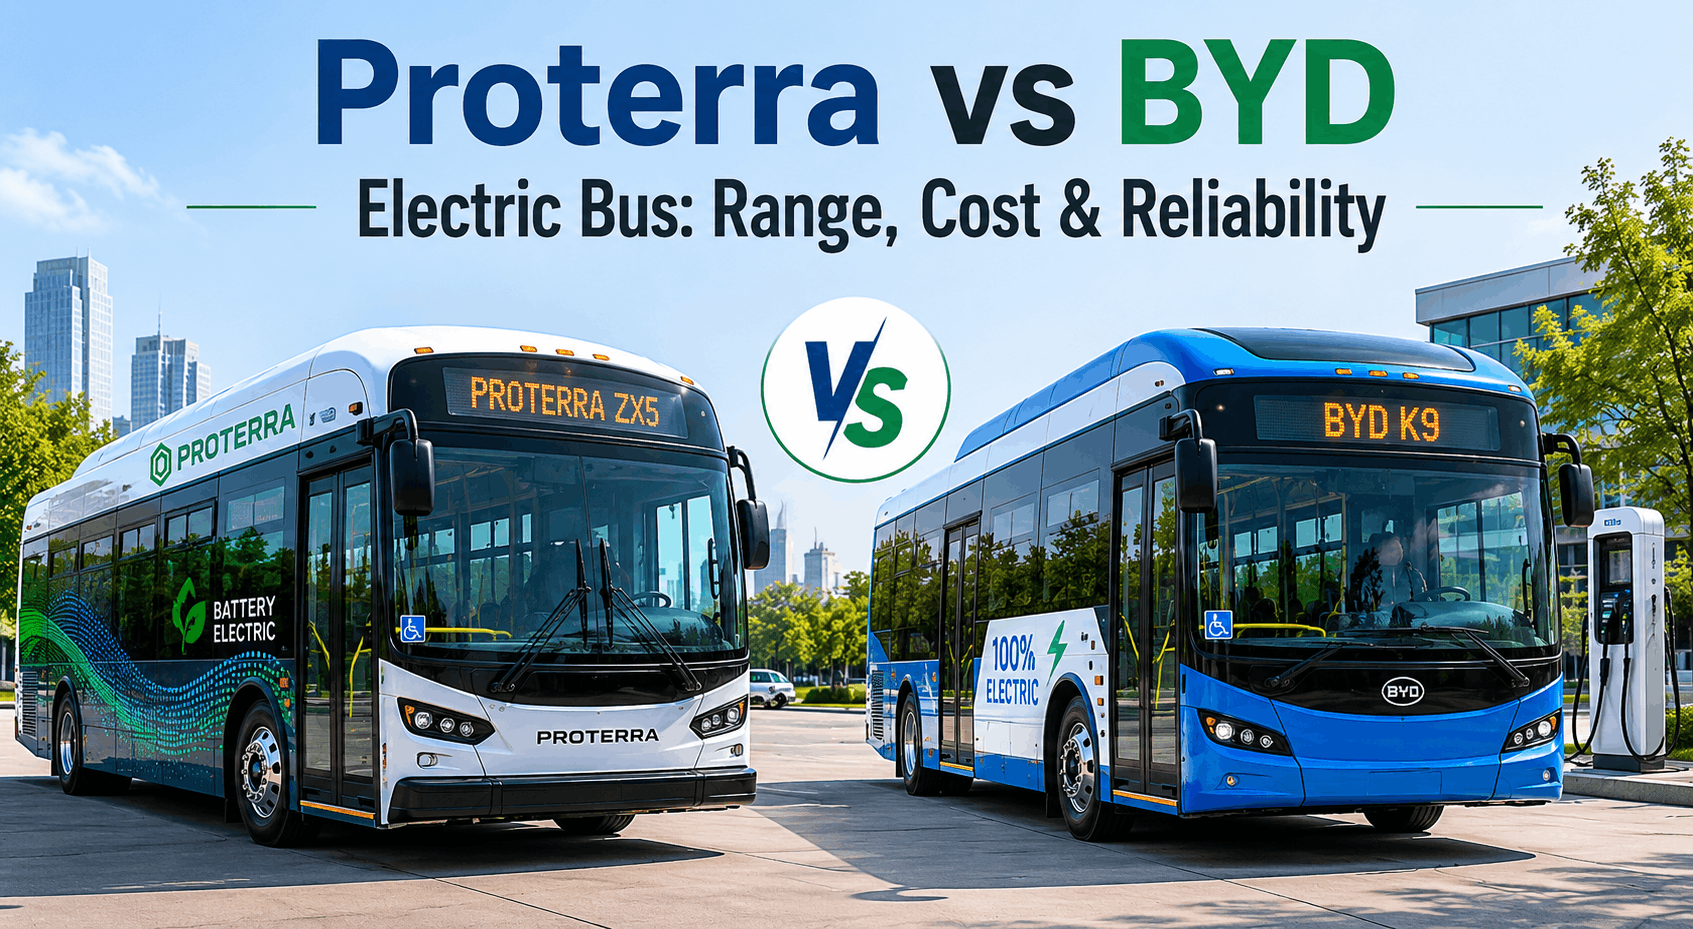
Proterra vs BYD Electric Bus: Range, Cost & Reliability
The electric transit bus market has consolidated rapidly. Proterra and BYD represent the two largest remaining platforms in North America—combining proven battery technology, charging compatibility, and operating cost data from thousands of deployed units. Yet fleet managers still struggle to choose between them. This guide compares both OEMs on range, battery reliability, charging infrastructure, total cost of ownership, and maintenance requirements, using 2026 operating data from fleets that have deployed both platforms.
ELECTRIC BUS PROCUREMENT · TECHNICAL GUIDE · 2026
Proterra vs BYD: Electric Bus Comparison for Fleet Procurement
Compare battery performance, charging, operating costs, and reliability across North America's two leading EV bus manufacturers for 2026 deployment.
Proterra vs BYD — Market Position & Platform Maturity
Both manufacturers have shifted from early-stage deployment to production-scale manufacturing. However, their battery chemistry, charging strategies, and service ecosystems differ fundamentally—making them suited to different fleet operating profiles.
Proterra Strengths
Battery Management System (BMS)
High Value
Proterra's proprietary BMS optimizes cell temperature and charge distribution across the pack — delivering 310–330-mile range on 350 kWh, highest efficiency ratio in the market.
Fast Charging Technology
High Value
Proterra Opportunity DC charging (440 kW) adds 150 miles in 10 minutes — enabling in-route top-ups on high-demand routes without extended dwell times.
North American Support Network
High Value
Proterra operates 8 dedicated service centers in North America. Technician certification and warranty support built around North American duty cycles and climate conditions.
Proven Fleet Deployment
Medium Value
6,200+ Proterra buses in operation across 100+ North American fleets. Longest operational history provides confidence in reliability over 12-year lifecycle.
BYD Strengths
LFP Battery Chemistry
High Value
BYD's Lithium Iron Phosphate batteries are inherently safer and more stable than NCA/NCM — rated for 1,000,000+ miles before 80% capacity threshold. Longer effective lifespan, lower replacement risk.
Total Cost of Ownership
High Value
BYD buses cost $50–80K less than Proterra on purchase price. Over 12 years, TCO advantage reaches $120–150K per vehicle when accounting for energy efficiency and reduced maintenance complexity.
Global Manufacturing Scale
High Value
BYD manufactures 300,000+ vehicles globally annually. Parts availability is superior, warranty cost amortization is lower, and production lead times are shorter than single-market competitors.
Grid Integration Compatibility
Medium Value
BYD systems integrate with vehicle-to-grid (V2G) and demand response protocols — enabling fleets to participate in grid stability programs and earn revenue from stored battery capacity.
Battery & Range Comparison: Head-to-Head Specs
Battery technology is the core differentiator between EV platforms. Range, degradation curve, thermal management, and warranty coverage determine long-term ownership viability.
Battery Capacity & Chemistry
Proterra: 350 kWh NCA/NCM blend, energy density 160 Wh/kg. BYD: 280–300 kWh LFP, energy density 140 Wh/kg. Proterra higher density, BYD more thermally stable.
Range (GVWR 40K lbs, 55 mph avg)
Proterra: 310–330 miles. BYD: 260–280 miles. Proterra advantage critical on long-distance routes; BYD sufficient for urban 95%+ of North American routes.
Charging Speed (DC Fast Charge)
Proterra: 440 kW Opportunity charge adds 150 mi/10 min. BYD: 240 kW standard adds 100 mi/15 min. Proterra faster for high-frequency routes; BYD adequate for overnight depot charging.
Battery Degradation (at 500K miles)
Proterra: 92–94% remaining capacity. BYD: 94–96% remaining capacity. BYD LFP chemistry more resistant to degradation; Proterra warranty covers 80% floor.
Proterra: 1.8–2.0 kWh/mi at 55 mph. BYD: 2.1–2.3 kWh/mi at 55 mph. Proterra 10–15% more efficient; significant cost advantage on electricity-heavy routes (e.g., cold climates, hilly terrain).
Total Cost of Ownership: Electric Bus 12-Year Lifecycle
Purchase price is only 40% of an electric bus lifecycle cost. Battery management, electricity consumption, maintenance, and charging infrastructure drive the remaining 60% of operating expense.
Proterra Electric Bus — 12-Year TCO (40 ft, 280 annual days, 55 mi/day)
Based on $0.14/kWh blended electricity rate, depot overnight charging
$750K
Purchase price (Proterra battery bus)
$168K
12-year electricity cost (1.9 kWh/mi)
$65K
Maintenance + parts over lifecycle
$983K
Total 12-year TCO (Proterra)
BYD Electric Bus — 12-Year TCO (40 ft, 280 annual days, 55 mi/day)
Same operating conditions, depot charging, $0.14/kWh electricity
$670K
Purchase price (BYD K8 platform)
$208K
12-year electricity cost (2.2 kWh/mi)
$48K
Maintenance + parts over lifecycle
$926K
Total 12-year TCO (BYD)
"We deployed 25 Proterra buses for our express commuter lines and 40 BYD buses for urban local routes. Proterra's range and charging speed handles our longer suburban routes better. BYD's lower cost and battery reliability made sense for our predictable local-service fleet. Total program cost was $2.8M lower than choosing one vendor for both services."
Charging Infrastructure: Opportunity vs Depot Models
The choice between Proterra and BYD is partially a charging strategy decision. Proterra enables in-route opportunity charging (high CAPEX, low OPEX). BYD optimizes for overnight depot charging (lower CAPEX, moderate OPEX).
Opportunity Charging (Proterra)
IN-ROUTE MODEL
Proterra 440 kW chargers installed at terminal endpoints allow 10-minute top-ups between route cycles. Enables all-day service on long routes without mid-day depot returns. CAPEX: $200–250K per charger station.
Depot Charging (BYD)
OVERNIGHT MODEL
BYD buses designed for 6–8 hour overnight charging at depot via 120 kW chargers. Simpler infrastructure, lower grid demand, easier fleet management. CAPEX: $40–60K per charger, but 80–100 needed for large fleet.
Peak Grid Demand
INFRASTRUCTURE
Proterra opportunity charging concentrates load during peak commute hours — peak draw 2–3 MW for large fleet. BYD spread across 8 hours overnight — peak draw 400–600 kW, avoiding demand charges.
Charging Infrastructure Cost
CAPEX ANALYSIS
Proterra opportunity: $1–1.5M for 4–6 terminal chargers. BYD depot: $2.4–3.2M for 60–80 chargers + grid upgrade. BYD higher total CAPEX, but qualifies for larger federal grants (80+ units vs 4–6).
Operational Flexibility
ROUTING
Proterra buses can run longer, unpredictable routes with high-demand volatility. BYD requires predictable daily route structure to ensure full charge-down cycle utilization and fleet efficiency.
Ready to Compare Electric Bus Options?
Download our electric bus TCO calculator, charging strategy guide, and battery lifecycle analyzer — vendor-neutral fleet planning tools.
1. You have long, unpredictable commuter or express routes. Proterra's 310–330 mile range and in-route charging handle variable demand without mid-route charging anxiety. Ideal for suburban commute routes, airport shuttles, or express service.
2. Your route pattern requires mid-day quick top-ups. 440 kW Opportunity charging adds 150 miles in 10 minutes — enabling all-day service on extended routes without depot returns. Essential for high-frequency express lines.
3. Energy efficiency is a priority (cold climates, hilly terrain). Proterra's 10–15% efficiency advantage translates to $40–60K in electricity savings over 12 years. Significant in northern regions or mountainous operations.
4. Your fleet has advanced technical maintenance capability. Proterra's NCA/NCM chemistry and thermal management complexity require specialized technician training. Budget $50K+ annually for certification and ongoing support.
5. You're operating multiple EV platforms and need standardization. Proterra's unified charging ecosystem reduces deployment complexity if you're already running Proterra buses or considering future Proterra mixed-fleet growth.
When to Choose BYD — 5 Key Scenarios
1. You have predictable, repetitive urban local routes. BYD optimized for consistent daily patterns: fixed mileage, reliable charge-down cycles, overnight depot returns. Better for urban grid transit than variable-demand service.
2. Total cost of ownership is your dominant metric. $80K lower purchase price + simpler maintenance = $57K TCO advantage over Proterra. Over a 50-bus fleet, that's $2.85M total program savings.
3. Battery longevity and residual value matter. BYD LFP chemistry rated for 1,000,000+ miles with 94–96% capacity retention at end-of-life. 10-year/1,000K-mile warranty vs. Proterra's 8-year/500K-mile reduces mid-lifecycle replacement risk.
4. You need charging infrastructure deployment speed. BYD depot chargers simpler to install and integrate. Multiple chargers from a mature global supplier reduce procurement complexity. Less custom engineering = faster go-live.
5. Grid demand management is a constraint. If your utility charges peak-demand penalties, BYD's nighttime-only charging keeps peak below demand thresholds. Can save $15–20K annually in demand charges vs. daytime opportunity charging.
How much will electricity cost per mile to operate each bus?
At $0.14/kWh average rate: Proterra costs $0.27/mile ($1.9 kWh × $0.14). BYD costs $0.31/mile ($2.2 kWh × $0.14). Over 500,000 miles (12 years), Proterra saves $20,000 in fuel costs, but BYD's $80K cheaper purchase price dominates the equation.
What happens when battery capacity drops below warranty thresholds?
Proterra warranty floor is 60% capacity at 8 years/500K miles. BYD warranty floor is 70% capacity at 10 years/1M miles. If capacity drops below floor, manufacturer replacement cost runs $180–220K. BYD's higher floor and longer warranty reduces financial risk significantly in year 8–10.
Can I mix Proterra and BYD buses in the same fleet?
Yes, operationally feasible. Proterra for express/commuter routes, BYD for urban local service. However, separate charging infrastructure, technician training, and parts inventory increase complexity by 20–30%. Only recommended if route profiles are fundamentally different.
What's the typical delivery timeline for each manufacturer?
Proterra: 18–24 months. BYD: 16–20 months. Both improving supply chain stability. Order immediately if targeting 2027 deployment — 2026 production slots mostly booked.
Which manufacturer offers better service support?
Proterra: 8 dedicated North American service centers, certified technician network. BYD: Growing North American service presence (12+ centers), but still establishing technician certification ecosystem. Proterra currently more mature on support; BYD improving rapidly.
Make Your Electric Bus Procurement Decision in 2026
Compare battery technology, charging strategies, and total cost of ownership side-by-side. Get expert guidance on route-specific EV platform selection.