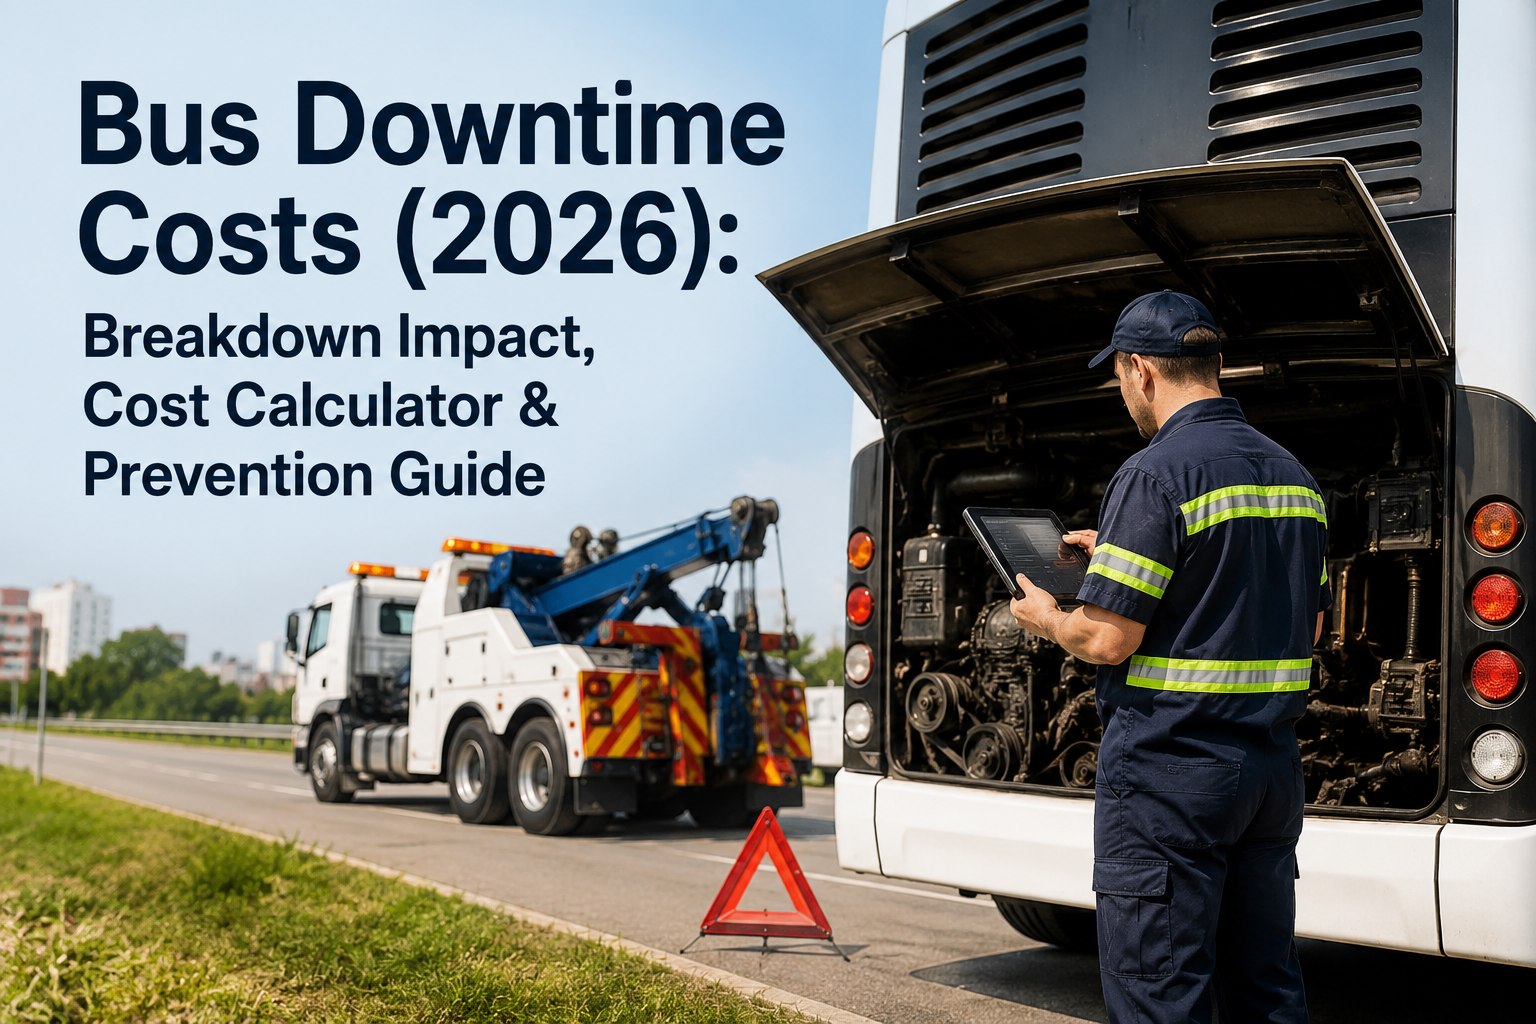
A bus that will not start is not just a mechanical problem. It is a financial event that starts at $180 per hour and climbs from there. This guide breaks down what bus downtime actually costs -- direct, indirect, hour by hour, day by day -- and shows exactly how a well-managed maintenance program cuts your fleet's breakdown costs by 40-60% in the first year.
Bus Downtime Costs: The Real Financial Impact of Every Breakdown
Direct, indirect, and long-tail breakdown costs -- with the numbers your board actually needs
- $180/hrTypical downtime cost
- 1.9xHidden cost multiplier
- 60-65%Breakdowns preventable
- Emergency labor$260
- Tow charge$450
- Sub bus rental$420
- Admin / dispatch$180
Anatomy of a Breakdown Day: What It Actually Costs
Most fleet managers can quote you the invoice from the last major breakdown. Almost none can tell you the full cost of the day it happened. The invoice is only the middle of the story. Costs start accumulating the moment the driver reports the fault at pre-trip, and they do not stop until the bus is back on route the next morning. Here is what a single mid-severity breakdown day looks like priced out hour by hour.
- 6:45 AM$0
Driver reports brake warning at pre-trip
Bus SB-207 fails DVIR. Route dispatcher notified. Panic begins.
- 7:00 AM+$90
Route dispatcher scrambles for sub
45 minutes of dispatcher time to reassign, call driver, notify school.
- 7:30 AM+$60
Morning route delayed 25 minutes
First parent calls come in. Front office logs three complaints in the first hour.
- 8:15 AM+$450
Tow truck dispatched to bus location
Base tow charge plus mileage. Bus removed from route lot. Route disruption spreads.
- 9:30 AM+$260
Bus arrives at shop, diagnosis begins
Emergency labor rate applies. $95/hr vs $65/hr scheduled. Two-tech diagnosis, 90 minutes.
- 1:00 PM+$120
Rush parts overnighted from regional depot
Shipping surcharge plus 30% part-price markup for rush order.
- 2:30 PM+$420
Afternoon route requires sub bus
Sub bus rented from neighboring district for PM route. Includes driver overtime rate.
- 6:00 PM$1,310
Repair complete (parts not included)
Bus back in service the next morning. Twelve hours since initial DVIR fail.
That $1,310 is before parts land on the invoice. Add the actual brake components at rush pricing and the true total lands around $1,650-$1,900 for a single day of downtime. Multiply that by even 3-4 breakdowns per month and downtime alone is running your fleet somewhere between $60,000 and $90,000 per year in costs most fleet managers cannot itemize. Book a demo to see full breakdown cost tracking per bus per event.
Direct vs. Indirect Downtime Costs: The Hidden Multiplier
The reason most fleet managers underestimate downtime costs is simple: half of the total never appears on any invoice. Direct costs are billed. Indirect costs are absorbed by other departments, other budgets, and other people's time. Understanding the split is how you make the true financial case for uptime investment.
- Emergency labor rate$260
- Tow charge$450
- Rush parts shipping$120
- Rush parts markup$200
- Sub bus rental$420
- Route dispatcher hours$90
- Parent notifications$60
- Reassigned driver hours$150
The invoice from your shop says $1,030. The actual event cost your fleet $1,750. That gap -- 70% of the total -- is the number the fleet manager never gets to point at because it lives in five different departments' time sheets. Until your CMMS is tracking every dispatcher hour, every sub bus reservation, and every parent complaint against the specific bus that caused it, you cannot build a real case for the maintenance program that would have prevented the whole day. Book a demo to see indirect cost tracking tied to specific breakdown events.
Cost by Duration: How Fast It Escalates
Downtime cost does not scale linearly with time. A four-hour road call and a four-day parts wait are financially different events. Every additional day adds new cost categories -- sub bus daily rates compound, driver reassignment stretches into scheduling headaches, and reputation cost starts showing up in enrollment conversations. Here is how the total escalates.
TIER 1 $6504 Hours
Simple road call, same-day return. Emergency labor + minor part + one missed route segment.
TIER 2 $1,4001 Day
Bus down full route day. Add tow, sub bus, dispatcher hours, full labor cycle. What most breakdowns look like.
TIER 3 $3,8003 Days
Parts backorder or diagnostic complexity. Sub bus compounds. Overtime driver shifts. Multiple complaint cycles.
TIER 4 $8,500+1 Week
Major mechanical failure. Full week of sub bus daily rate. Board-visible incident. Reputation stakes climb sharply.
Cost escalates roughly 5x from Tier 1 to Tier 3, then doubles again by Tier 4. This is why parts availability, diagnostic speed, and PM compliance matter so much -- they collectively determine which tier a given breakdown lands in. A well-run fleet turns most incidents into Tier 1 events. A poorly-run fleet stacks Tier 3 and Tier 4 outages until they define the annual budget. Book a demo to see downtime duration tracking and cost aggregation per event.
Fleet Uptime Benchmarks: What Each Tier Actually Costs
Fleet uptime is the most direct measure of how well your maintenance program is working. Below is what each uptime tier means in real numbers on a typical 50-bus fleet, using the average $1,750 per breakdown event figure from the previous section. The gap between crisis and best-in-class is not a small optimization. It is an entire operating budget.
| Tier | Uptime | Breakdowns / bus / yr | Annual fleet cost (50 buses) |
|---|---|---|---|
| Crisis | <85% | 12+ | $840K+ |
| Chronic | 85-92% | 6-10 | $450K |
| Average | 92-95% | 4-6 | $280K |
| Above avg | 95-97% | 2-4 | $150K |
| Best-in-class | 97%+ | <2 | $80K |
The difference between a chronic fleet (85-92% uptime) and a well-managed fleet (95-97%) is $300,000 per year on a 50-bus operation. That number alone justifies almost any CMMS budget request. Most districts and agencies sit in the "Average" or "Chronic" tier without knowing it, because they do not track uptime rigorously enough to place themselves on this scale. Sign up free and see your fleet's current uptime tier within a week.
What Actually Causes Bus Downtime
Bus breakdowns are not random. They cluster around specific systems, and a large majority are preventable with the right maintenance program. Here is the industry-typical breakdown of root causes by percentage of downtime events, with each category tagged for its preventability. The number that surprises most fleet managers is how much of it never had to happen.
01PREVENTABLE Brake System Failures
18%Pad wear, air leaks, valve failures. All catchable at scheduled PM if the DVIR and inspection cycle actually runs on time.
02PREVENTABLE HVAC Failures (Seasonal)
15%AC failures in summer, heater failures in winter. Nearly all avoided with pre-season PM in April and October.
03PARTIALLY Tire Failures
14%Tread wear is preventable via inspection cycle. Sidewall damage and blowouts are partly random road hazard.
04PREVENTABLE Cooling & Thermal
13%Overheating, coolant loss, radiator failure. Caught early with fluid analysis and pressure testing.
05PARTIALLY Electrical Failures
11%Battery, alternator, starter. Predictable with voltage logging. Wiring and sensor failures are more random.
06PREVENTABLE Transmission Issues
9%Slipping, hard shifts, fluid contamination. Nearly always avoidable with transmission fluid analysis.
07PARTIALLY Fuel & Air Systems
8%Fuel filter neglect is preventable. Injector failures and DEF sensor issues are less predictable.
08VARIES Other Systems
12%Suspension, body, door mechanisms, exhaust aftertreatment. Mix of preventable and reactive causes.
Roughly 6 out of every 10 breakdowns your fleet suffers did not have to happen. That is the entire foundation of the maintenance cost reduction argument: the same shop hours redirected from emergency repairs to scheduled PM would eliminate more than half of your unplanned downtime within 12 months. Book a demo to see root cause tracking and preventability analytics per bus.
Before / After: What PM Software Actually Changes
Abstract percentages do not sell software. Specific scenarios do. Here are five real breakdown situations most fleet managers have lived through -- with the outcome under a paper or spreadsheet-based system versus a bus-specific CMMS holding the schedule. The difference is the entire value proposition.
Morning Brake Warning at Pre-Trip
Emergency shop visit. Route missed. $1,750 event. Parent complaints. Same failure repeats in 90 days on next bus.
Brake wear flagged at last scheduled PM two weeks earlier. Replaced overnight during off-hours. Zero route disruption. $180 scheduled labor cost.
Coolant Temperature Climbing
Bus overheats on route. Tow to shop. Engine damage possible. $2,800-4,200 repair. Driver waits roadside 90 minutes.
Fluid analysis catches coolant contamination 30 days earlier. Water pump replaced during scheduled service. $340 total cost.
Battery Slow Crank Reported by Driver
Note in a paper log gets lost. Bus refuses to start Monday morning. Panic reassignment. $650 emergency tow and jump service.
DVIR entry creates instant work order. Battery load test scheduled that afternoon. Battery replaced Friday for $220. Monday morning: routine.
Transmission Clunk Between Shifts
Ignored for weeks. Complete transmission failure at 90K miles. $12,000-16,000 rebuild. Bus down 7-10 days.
Fluid analysis flags wear metals 60 days early. Filter and fluid service $450. Rebuild avoided. Bus stays in service.
Tire Tread Depth Approaching Legal Minimum
Missed at inspection. Blowout on route. Tow bill, sub bus, incident report, DOT documentation. $1,200 total impact.
DVIR photo captures 3/32" tread. Auto work order. Replaced during Saturday PM window. Route uninterrupted.
Every one of those scenarios repeats itself across every bus fleet in the country, every week. The system does not eliminate all breakdowns -- some things still fail unpredictably. It converts the majority of failures from surprise emergencies into scheduled maintenance events, which cost a fraction as much and cause zero passenger disruption. Book a demo to see how BusCMMS converts unplanned downtime into planned PM.
How BusCMMS Cuts Fleet Downtime
The features that reduce downtime are specific and measurable. Generic fleet software tracks work orders after they exist. A bus-specific CMMS prevents the work orders in the first place -- and when they are unavoidable, it makes sure they resolve in Tier 1, not Tier 3.
Digital DVIR Instant Workflow
Driver fails an item at pre-trip; work order opens automatically. No paper log lost, no hand-off delay.
PM Auto-Scheduling
Fuel-type-specific PM intervals per bus, triggered by mileage or calendar. Nothing goes overdue.
Downtime Analytics Per Bus
Hours out of service per event, per bus, per system. Identifies chronic problem vehicles for replacement.
Root Cause Coding
Every breakdown tagged by system and preventability. Trends surface which categories to attack first.
Parts Availability Tracking
Min-max inventory levels prevent rush shipping. Fast repairs stay in Tier 1 instead of escalating to Tier 3.
Uptime Dashboard
Real-time fleet uptime percentage. Board-ready trend charts by month, quarter, and year.
BusCMMS reports customer fleets typically reduce unscheduled downtime by 40-60% within 12-18 months, based on customer-reported outcomes. On a chronic 50-bus fleet losing $450K per year to breakdowns, that is $180K-$270K in recovered budget every year, plus a fleet reputation that stops generating parent complaints. Book a demo to see uptime tracking and downtime reduction analytics live.
The Bottom Line on Bus Downtime Costs
Downtime is the most expensive line item nobody itemizes. It hides in dispatcher time, sub bus reservations, driver overtime, and parent complaint tickets. The moment your fleet starts tracking the full cost per event -- direct plus indirect -- the case for maintenance investment builds itself. The math has been the same for every fleet that ran the exercise: 40-60% of your downtime costs are recoverable, and the software that recovers them costs a fraction of what a single tier-4 breakdown costs today. Sign up free and start tracking downtime costs per bus this week.
How much does one day of bus downtime actually cost?
A typical mid-severity bus breakdown day costs $1,400-$1,900 when both direct and indirect costs are included. Direct costs (emergency labor, tow, rush parts) usually run $850-$1,100. Indirect costs (sub bus rental, dispatcher time, driver reassignment, parent notifications) add another $550-$800. Simple 4-hour road calls run around $650. Multi-day outages with parts wait can reach $3,800-$8,500 as sub bus daily rates compound and overtime accumulates. Most fleet managers underestimate the true per-event cost by 40-70% because the indirect portion is absorbed across other departments.
What are direct vs. indirect bus downtime costs?
Direct costs appear on the maintenance invoice: emergency labor rate (typically $85-$120/hour vs $55-75 scheduled), tow charge ($200-600), rush parts shipping, and rush parts markup. Indirect costs are absorbed by other budgets and do not appear on any single invoice: substitute bus rental ($150-300 per route per day), route dispatcher time managing the disruption, parent notification and complaint handling, driver reassignment and overtime, and administrative overhead. Indirect costs typically add 60-80% on top of direct costs, creating what is called the hidden cost multiplier -- roughly 1.7x to 2.0x the invoice amount.
What percentage of bus breakdowns are actually preventable?
Roughly 60-65% of bus breakdowns are preventable with proper preventive maintenance. Brake system failures (18% of breakdowns), HVAC failures (15%), cooling and thermal issues (13%), and transmission problems (9%) are almost entirely preventable via scheduled PM and fluid analysis. Tire failures (14%) and electrical failures (11%) are partially preventable -- tread wear and battery testing are predictable, but sidewall damage and sensor failures are more random. Fleets running proper PM programs see their unscheduled downtime drop 40-60% within 12-18 months. This is the entire foundation of the maintenance ROI argument.
What is a good fleet uptime percentage for bus operations?
Fleet uptime tiers break down as follows. Best-in-class fleets run 97%+ uptime with fewer than 2 breakdowns per bus per year. Above-average fleets sit at 95-97% with 2-4 breakdowns per bus annually. Industry average is 92-95% (4-6 breakdowns per bus per year). Chronic fleets run 85-92% uptime with 6-10 breakdowns per bus annually. Crisis fleets fall below 85% and experience 12 or more breakdowns per bus per year. On a 50-bus fleet, the annual cost difference between chronic and above-average uptime is roughly $300,000 in avoidable downtime expense.
How does BusCMMS help reduce fleet downtime costs?
BusCMMS reduces downtime through five specific mechanisms. Digital DVIRs turn every failed inspection item into an instant work order with zero paper delay. Fuel-type-specific PM auto-scheduling ensures nothing goes overdue on any bus in the fleet. Root cause coding tags every breakdown by system and preventability to surface fleet-wide problem trends. Downtime analytics per bus quantify hours out of service in dollar terms per event, direct plus indirect. Parts availability tracking prevents rush shipping and keeps repairs in Tier 1 (same-day return) rather than escalating to Tier 3 or 4. Customer-reported outcomes typically show 40-60% unscheduled downtime reduction within 12-18 months.







