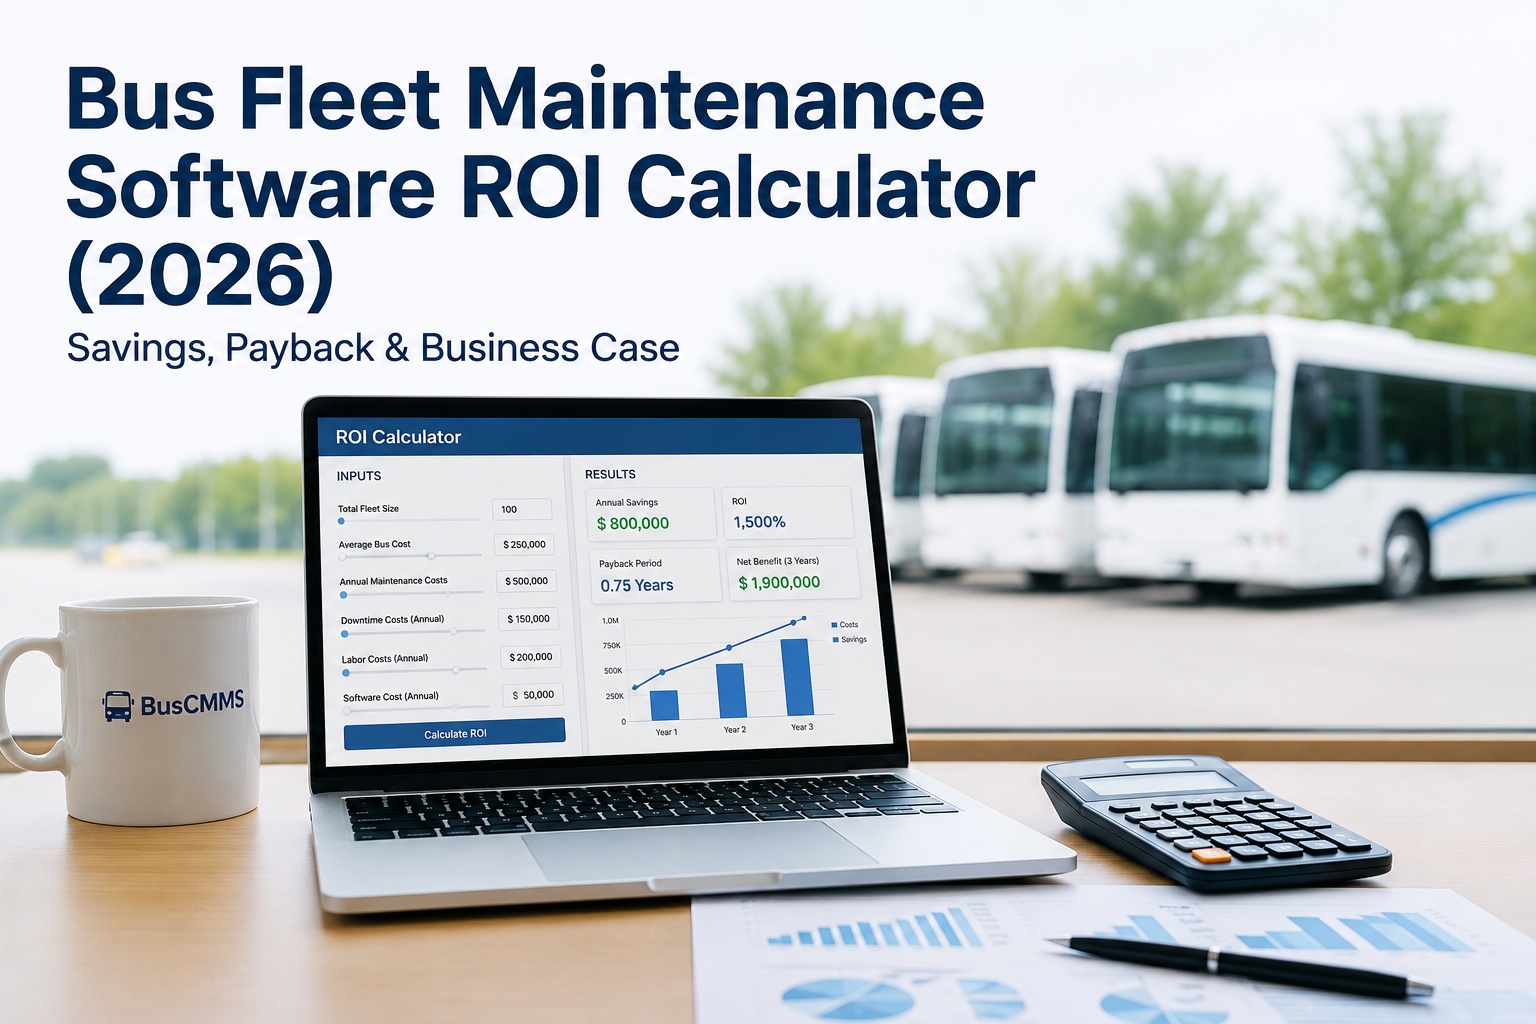
You need to justify a software subscription to your board. This guide gives you the exact bus fleet maintenance software ROI calculator formula, the five inputs it requires, the four outputs it produces, and worked examples across three fleet sizes -- so you can plug in your own numbers and walk into the meeting with approval.
Bus Fleet Maintenance Software ROI Calculator
The exact inputs, formula, and worked examples to build your own ROI calculator
- 5Calculator inputs
- 4Output metrics
- 1Formula that runs it
The 5 Inputs Every ROI Calculator Needs
A calculator is only as good as its inputs. Vague inputs produce ROI numbers you cannot defend. Specific, sourced inputs produce numbers your board respects. These five variables are the entire foundation of any credible bus fleet maintenance software ROI calculation. Get these five right and everything downstream falls into place.
01COUNT Fleet Size
Range: 10-500 buses
Number of active buses in your fleet. Include spares if they get maintenance work. Exclude decommissioned units.
If unknown: Use active DOT-registered VIN count from your insurance policy.
02MONEY Current Annual Maintenance Spend
Range: $200K-$10M+
Total maintenance dollars per year: labor, parts, fluids, tires, PM, unscheduled repairs, tow bills, warranty deductibles. Exclude fuel and capital.
If unknown: Multiply fleet size × $30K-$40K per bus as starting estimate.
03PERCENTAGE Current PM Compliance Rate
Range: 40-95%
Percentage of PMs completed on schedule. Paper-based fleets typically run 50-65%. Well-run CMMS fleets run 90-95%. The single most impactful input.
If unknown: Estimate 60-70% for paper-based fleets, 75-85% for basic tracking, 90%+ for mature CMMS.
04COUNT Average Miles / Bus / Year
Range: 15K-60K miles
Fleet-wide average annual miles per bus. School buses 20K-30K. Transit 40K-50K. Charter 60K+. Pull from telematics or odometer readings.
If unknown: Use total fleet miles from state DOT filings divided by active fleet count.
05MONEY Software Cost / Year
Range: $18K-$100K+
Annual CMMS subscription cost for your fleet size. Typically scales at $300-$600 per bus per year for a bus-specific platform.
If unknown: Estimate fleet size × $500 per bus as a working figure.
If you have all five inputs, you can run a credible ROI calculation on any bus fleet in the country. If you have three or four, use the fallback estimates for the missing ones and label them as assumptions in your presentation. Missing inputs are not disqualifying -- unlabeled assumptions are. Book a demo and BusCMMS will help you nail down your fleet's actual input numbers.
The Core ROI Formula: How It Actually Works
The top-line ROI formula is trivial. The savings calculation underneath it is where the actual work happens. Total savings is the sum of five distinct financial recoveries, each with its own reduction factor. Here is the complete equation your calculator runs, with the industry-typical reduction ranges for each component.
- 01Reduced Unscheduled RepairsCurrent repair spend × 0.40 to 0.60
- 02Warranty Capture RecoveryMissed warranty × 0.30 to 0.50
- 03Downtime Reduction SavingsCurrent downtime cost × 0.40 to 0.60
- 04Parts Inventory OptimizationCurrent parts spend × 0.10 to 0.15
- 05Asset Life Extension ValueAnnual depreciation × 0.15 to 0.25
The five reduction factors above are the range where actual customer outcomes typically fall. Use the low end of each range for a conservative pitch -- your board is more likely to approve a case that says "we expect 900% ROI conservatively" than one claiming 2,000%. Use the midpoint for realistic. Use the high end only if you can defend it with prior benchmarks. Book a demo to see all 5 components calculated on your actual fleet numbers.
Sensitivity Analysis: Which Input Moves ROI the Most
Not all inputs affect the outcome equally. A 10% change in your PM compliance estimate moves the ROI number by 40%. A 10% change in software cost barely moves it at all. Sensitivity analysis tells you where to spend the most time getting the input accurate -- and where a rough estimate is fine. Here is how each input shifts the annual savings estimate from a $530K baseline on a 50-bus fleet.
- PM compliance
- Repair spend %
- Fleet size
- Miles / year
- Software cost
PM compliance is the runaway winner. If you get one input right, make it this one. The reason is mechanical: PM compliance determines how much of your current unscheduled repair spend the software can recover, and unscheduled repairs are the largest single cost bucket in the formula. Software cost barely appears on the chart because it affects only the denominator, and the denominator is small compared to the savings pool. Sign up free and pull your fleet's real PM compliance rate directly from work-order data.
The 4 Output Metrics Your Calculator Should Produce
A single ROI percentage is not enough for a board presentation. Different decision-makers care about different metrics. The CFO wants payback period. The superintendent wants annual savings dollars. The board wants three-year cumulative return. A complete calculator produces all four -- each answers a different question in the room.
Annual Savings
$180K - $1.8MTotal dollars recovered per year across all 5 components. The single number your operations budget will actually feel.
Payback Period
3-6 weeksHow long until cumulative savings equal software subscription cost. The metric CFOs approve fastest.
Year 1 ROI %
800-2,000%The headline percentage. Highest-impact single metric for board presentations. Sensitive to input accuracy.
3-Year Cumulative Return
$540K - $5.4MTotal value delivered over 3 years assuming Year 2 and 3 continue at Year 1 savings levels. Best long-term view.
Put all four on the same board slide. Different members will latch onto different metrics, and having all four ready pre-empts the objection "what about payback" or "what about long-term value." A complete slide answers every question before it gets asked. Book a demo to see all 4 outputs computed live from your fleet data.
Worked Example: Small, Medium, and Large Fleet
Theory does not sell software; worked examples do. Below is the complete calculator run for three fleet sizes: a 20-bus rural district, a 50-bus school district, and a 150-bus transit agency. Every input, every intermediate calculation, and every output metric shown -- so you can trace the math and adapt it to your fleet.
| Variable | Small (20-bus) | Medium (50-bus) | Large (150-bus) |
|---|---|---|---|
| INPUTS | |||
| Fleet size | 20 | 50 | 150 |
| Annual maintenance | $500K | $2.0M | $7.0M |
| PM compliance | 60% | 65% | 70% |
| Miles / bus / year | 22K | 25K | 45K |
| Software cost / yr | $18K | $30K | $85K |
| SAVINGS CALCULATION | |||
| Reduced repairs | $88K | $250K | $860K |
| Warranty recovery | $30K | $80K | $270K |
| Downtime savings | $25K | $70K | $210K |
| Parts optimization | $20K | $60K | $200K |
| Asset life value | $35K | $100K | $310K |
| OUTPUT METRICS | |||
| Annual savings | $198K | $560K | $1.85M |
| Payback period | 5 wks | 4 wks | 3 wks |
| Year 1 ROI | 1,000% | 1,766% | 2,076% |
| 3-Year return | $594K | $1.68M | $5.55M |
Notice how ROI percentage scales with fleet size. Larger fleets show higher percentage returns because software cost grows sub-linearly with fleet size, while savings scale nearly linearly. This is why transit agencies with 100+ buses see the largest ROI multiples -- their software cost is spread over a much larger savings base. Book a demo to see your fleet's version of this exact worked example.
5 Common Calculator Mistakes That Undercount Your ROI
Most fleet managers who build their first ROI calculation come in low -- sometimes by 40-60%. The reason is not that they are being conservative on purpose. They are missing entire cost categories that belong in the savings pool. Avoid these five mistakes and your calculation will land close to what the software actually delivers.
- 01
Forgetting Indirect Downtime Costs
The mistake: Only counting invoice-visible costs. The fix: Include sub bus rental, dispatcher hours, driver reassignment, and parent-call handling. Indirect costs typically add 60-80% to direct.
- 02
Using Industry Averages Instead of Your Data
The mistake: Plugging in $1.20/mile because "that is average." The fix: Pull your actual maintenance ledger. Your number is probably higher, which means your recovery pool is larger.
- 03
Skipping the Asset Life Extension Value
The mistake: Ignoring the fact that better-maintained buses last 15-25% longer. The fix: Include annual depreciation × 0.15-0.25 as an ROI component. This alone often adds 20-30% to total savings.
- 04
Ignoring Warranty Capture Recovery
The mistake: Assuming your fleet already captures all eligible warranty. The fix: Most fleets miss 30-40% of eligible claims. Include the recovery of that gap in your savings pool.
- 05
Underestimating Current PM Compliance Gap
The mistake: Assuming you run 85% PM compliance because your team says so. The fix: Actual paper-tracked compliance rates are usually 55-70%. The larger the gap, the larger the ROI.
Every one of these mistakes shrinks the projected ROI, which shrinks the business case, which shrinks the odds of budget approval. Getting them right does not inflate the calculation -- it makes it accurate. And accurate always wins in a board meeting. Book a demo to get help checking your calculator against all 5 common mistakes.
BusCMMS Ships With the ROI Calculator Built In
You can build your ROI calculator in a spreadsheet using this guide. Or you can use the one that comes pre-loaded with BusCMMS, populated automatically with your actual fleet data from day one. Both work. One takes you two weeks. The other takes you 20 minutes on a demo call.
Live ROI Dashboard
All 5 savings components tracked in real time. Live annual savings, YTD payback, and cumulative ROI per bus.
PM Compliance Auto-Tracked
The single most sensitive ROI input auto-calculated from work-order completion data. No estimation required.
Warranty Capture Engine
Actual dollars recovered from warranty claims tracked per bus. Feeds directly into the ROI savings pool.
Downtime Cost Tracking
Direct plus indirect breakdown costs per event. Feeds the downtime reduction component of ROI.
Parts Inventory Analytics
Auto-reorder, dead-stock reports, duplicate prevention -- the parts optimization ROI component measured in real dollars.
Board-Ready ROI Reports
One-click PDF export with all 4 output metrics, 5 savings components, and 3-year projection. Ready for the next meeting.
Fleets running BusCMMS report actual Year 1 ROI between 800% and 2,000% depending on baseline conditions, based on customer-reported outcomes. That range matches the calculator predictions in this guide almost exactly -- because the calculator is not a projection tool. It is a reflection of what the software actually delivers month after month. Book a demo to see the live ROI dashboard running on real fleet data.
The Bottom Line on ROI Calculator Math
The ROI calculator is not a marketing tool. It is a translation tool. It converts operational data your maintenance team already has into financial language your finance team already trusts. The inputs come from your ledger. The reduction factors come from industry benchmarks. The outputs come from arithmetic. When the case gets denied, it is almost never because the math was wrong. It is because the presentation left the math implicit instead of showing it explicitly on the slide. Run the calculator. Show the work. Get approved. Sign up free and start building your Year 1 ROI case today.
What inputs do I need to calculate bus fleet maintenance software ROI?
Five inputs drive the calculation: fleet size (number of active buses), current annual maintenance spend (labor + parts + fluids + tires + repairs + PM), current PM compliance rate (percentage of PMs completed on schedule), average miles per bus per year, and software subscription cost per year. Fleet size and software cost are easy to source. PM compliance is the highest-leverage input -- pulling this from your actual work-order data instead of estimating changes your ROI number by up to 40%. If any input is unavailable, use the fallback estimates rather than skipping it entirely.
What is the ROI formula for CMMS or fleet maintenance software?
Top-line formula: ROI% = ((Total Annual Savings − Software Cost) / Software Cost) × 100. Total Annual Savings is the sum of five components: reduced unscheduled repairs (current repair spend × 0.40-0.60), warranty capture recovery (missed warranty × 0.30-0.50), downtime reduction savings (current downtime cost × 0.40-0.60), parts inventory optimization (current parts spend × 0.10-0.15), and asset life extension value (annual depreciation × 0.15-0.25). Use low-end factors for conservative estimates, midpoint for realistic projections. Well-managed deployments typically recover 20-30% of current annual maintenance spend within 12 months.
What is a typical payback period for bus fleet maintenance software?
Payback periods for bus fleet maintenance software typically fall between 3 and 6 weeks. This is faster than most software categories because savings begin the day the first PM work order gets scheduled, and cumulative savings equal the annual subscription cost within a month or two for most fleets. Smaller fleets (under 30 buses) see payback around 5-6 weeks. Medium fleets (30-80 buses) hit payback in 3-5 weeks. Large transit fleets (100+ buses) see payback in 2-3 weeks because software cost is spread over a larger savings base.
Which ROI calculator input is most important to get right?
Current PM compliance rate is the single most sensitive input. A 10% change in this input can shift the calculated annual savings by 40%. This is because PM compliance determines how much of your current unscheduled repair spend the software can convert to lower-cost scheduled work, and unscheduled repairs are the largest cost category in the savings pool. If you can only invest time in one input, pull PM compliance from actual work-order completion data rather than estimating it. Fleet size and software cost matter proportionally but rarely change the ROI verdict. Software cost affects only the denominator, and the denominator is small relative to the savings numerator.
How does BusCMMS's built-in ROI calculator work?
BusCMMS pre-loads the five-input, five-component ROI calculator and populates it automatically with real fleet data starting on day one. PM compliance rate calculates from work-order completion percentages. Warranty capture tracks per component per bus. Downtime cost aggregates direct plus indirect per event. Parts optimization measures reorder efficiency and dead-stock avoidance in real dollars. Asset life extension calculates from depreciation schedule adjustments. The live ROI dashboard displays annual savings, YTD payback, Year 1 ROI, and 3-year cumulative return in real time. Board-ready PDF export produces the complete calculator in one click.







