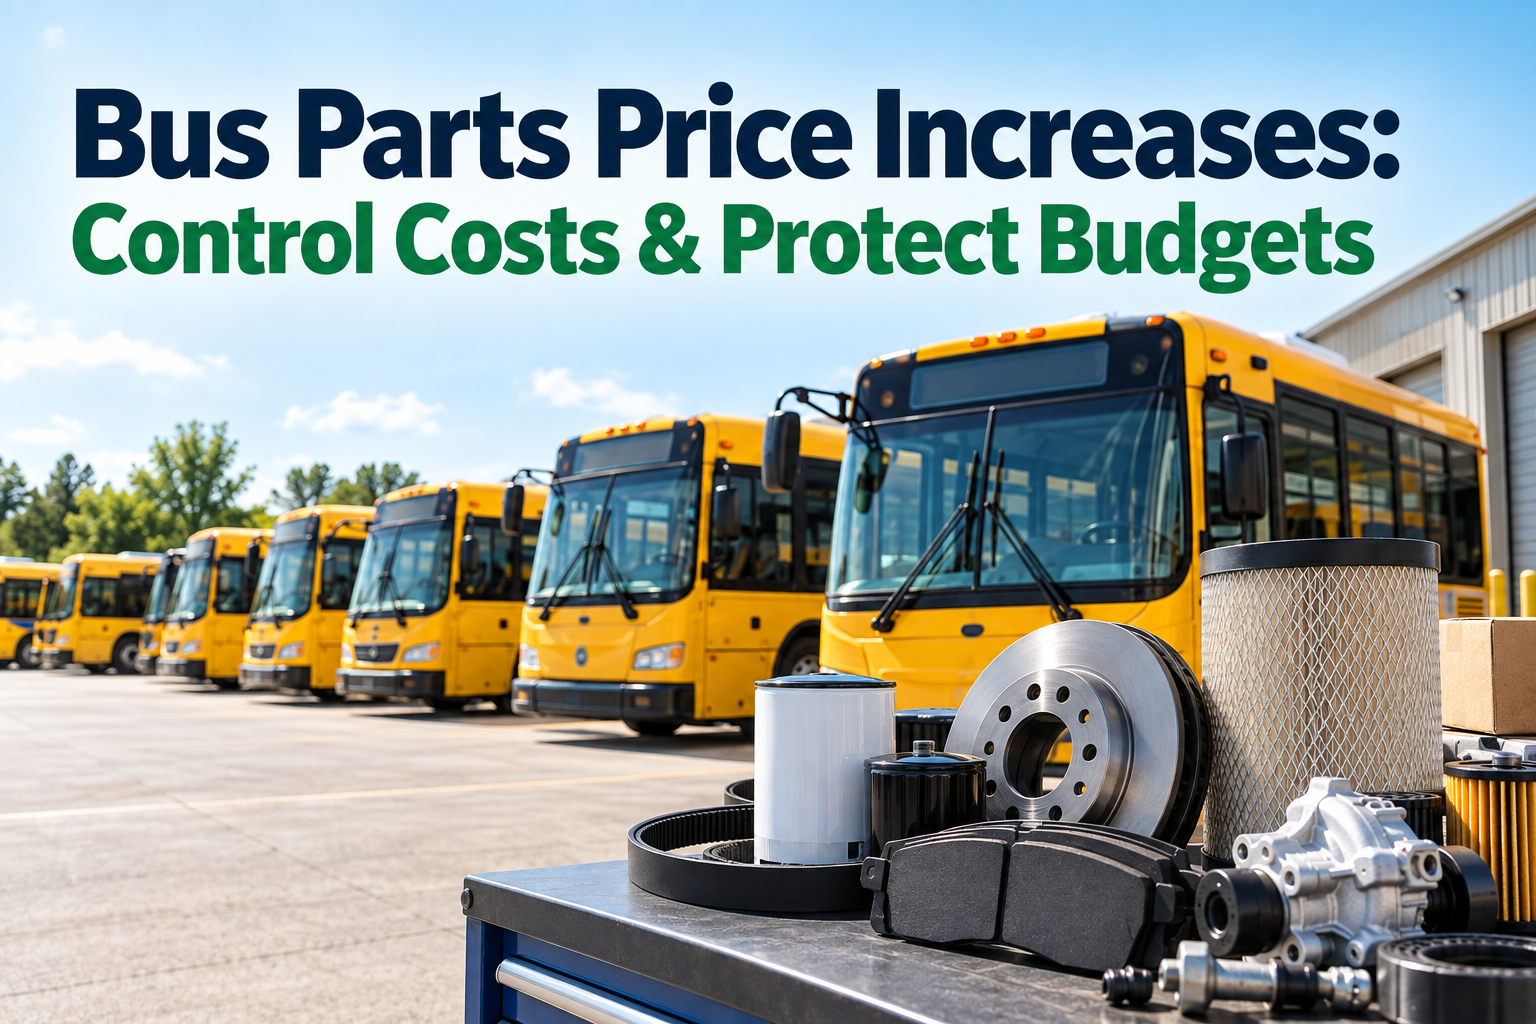
When suppliers raise prices,bus parts price increases can push maintenance budgets higher even when the number of repairs stays flat. Parts and fleet managers need to know which components changed price, how much inventory is exposed, where those parts are being consumed, and whether another source or stocking decision makes sense. A parts-control process turns supplier inflation into specific purchasing, inventory and maintenance actions instead of an unexplained budget overrun.
The Supplier Raised the Price. Your Budget Still Needs a Plan.
See which parts changed, where the dollars are concentrated, which buses are consuming them, and what your team should buy, stock, source or investigate next.
Measure the Increase Against How Many Parts You Actually Use
A 30% price increase on a rarely used component may matter less than a 7% increase on a high-volume maintenance item. Convert supplier price changes into annual exposure by combining the unit-cost change with expected usage. That gives finance and maintenance a more useful question: which price changes can materially move the parts budget?
BusCMMS can help connect parts records to maintenance activity so teams can review consumption with vehicle and work-order context. See the BusCMMS parts and inventory workflow.
Know How Much Budget Is Already Sitting on the Shelf
Price inflation changes more than the next purchase order. It also changes the economics of what you keep in stock. Review on-hand quantity, unit cost, usage rate, lead time and criticality together. High-value slow movers tie up cash, while critical fast-moving items can create downtime if stock runs out.
High value · slower use
Alternators / assembliesHigh value · high operational need
Critical componentsLower value · slower use
Low-demand stockLower value · fast use
Routine service itemsOn handHow many units are available?
UsageHow quickly is stock consumed?
Lead timeHow difficult is replenishment?
CriticalityCan a stockout sideline a bus?
Compare More Than the Lowest Unit Price
A lower quote is not automatically the lower-cost decision. Supplier comparison should also consider availability, lead time, freight, warranty, approved equivalents and the operational consequence of waiting. Use a consistent part specification and purchasing scope so the comparison is meaningful.
A Price Increase Hurts More When the Same Bus Keeps Consuming the Part
Supplier inflation and maintenance reliability can compound each other. If a component costs more and a small group of buses repeatedly consumes it, the budget impact grows faster. Rank usage by part, vehicle and work order, then investigate repeat replacement patterns rather than treating every issue as routine inventory consumption.
Connecting the part to the work order and bus makes the next question obvious: is the problem procurement, component quality, installation, operating conditions or an unresolved vehicle issue? Start organizing parts usage in BusCMMS.
Give Every Parts-Cost Signal a Purchasing Action
Approved part, validated demand and acceptable total purchase cost.
Action → purchaseCritical or fast-moving item where a stockout can extend downtime.
Action → set levelCompare qualified suppliers, terms, freight and approved alternatives.
Action → quote reviewRepeated use on a vehicle or system may signal a maintenance problem.
Action → open historyInventory Cost Control Is a Balance, Not a Race to Zero Stock
Reducing inventory indiscriminately can exchange carrying cost for vehicle downtime. Overstock ties up budget and shelf space; understock can leave a bus waiting for a critical component. Set stocking decisions using actual usage, replenishment time and operational criticality rather than a single fleet-wide rule.
Slow-moving inventory
Obsolete / superseded parts
Duplicate purchasing
Reduce carefullyEmergency purchasing
Premium freight
Extended downtime
Protect critical itemsTranslate Supplier Changes Into a Maintenance Budget Conversation
Finance needs more than a list of new prices. Build a parts forecast that combines the current unit cost, expected demand and known purchasing changes. Separate price-driven variance from usage-driven variance. That distinction tells leaders whether the budget problem is primarily supplier inflation, higher maintenance consumption, or both.
That is a stronger budget discussion than simply reporting that “parts are more expensive.” See how BusCMMS can support parts-cost visibility.
For teams that need a clearer connection between purchasing, inventory and the maintenance work consuming parts, book a BusCMMS parts-control walkthrough.
Review the Few Items With the Power to Move the Budget
Which items changed materially since the previous purchase?
Which price changes multiply across frequent consumption?
Is one bus or model consuming the part repeatedly?
Could sourcing changes create operational downtime?
How much budget is tied up in current inventory?
Give Parts, Maintenance and Finance the Same Cost Story
A short recurring review keeps supplier changes from becoming year-end surprises. Look at price changes, high-value purchases, fast-moving stock, repeat vehicle consumption, stockouts and budget variance together. Each exception should end with an owner and a next action.
What changed since last review?
Which changes matter most?
Which buses consume the parts?
Any overstock or stockout risk?
Buy, stock, source or investigate?
If your team is still reconciling parts purchases separately from maintenance activity, start building a connected parts and maintenance record.
You Cannot Stop Parts Inflation, but You Can Make Its Budget Impact Easier to Control
Bus parts price increases become more manageable when the fleet can separate supplier price effects from maintenance consumption. Track unit-cost changes, multiply them by actual usage, compare suppliers in context, right-size stock, connect issued parts to work orders and investigate repeated component use. BusCMMS supports that operating discipline by bringing parts and maintenance records closer together, helping teams protect the fleet maintenance budget with better evidence instead of relying on purchasing totals alone.
Parts Inflation, Inventory & Budget Questions
Five practical answers for parts managers, fleet leaders and finance teams.
01How should a fleet respond to bus parts price increases?+
Start by identifying which unit prices changed, then combine each change with expected usage to estimate budget exposure. Prioritize high-impact items, compare qualified supplier options, review stocking levels and investigate abnormal vehicle-level consumption.
02How do you measure the budget impact of parts inflation?+
For a simple exposure estimate, multiply the change in unit price by expected purchase or usage volume for the period. Keep price-driven variance separate from changes caused by higher or lower maintenance consumption.
03Should a fleet buy extra inventory before prices rise again?+
Not automatically. Consider actual usage, lead time, criticality, shelf life where relevant, storage, cash tied up in stock and the risk of obsolescence. Buying more can protect availability for some items but create overstock for others.
04How can parts usage reveal maintenance problems?+
If the same component is repeatedly issued to the same vehicle or system, review the associated work orders. The pattern may justify investigation into diagnosis, installation, component quality, operating conditions or an unresolved underlying failure.
05How does BusCMMS help with bus parts and inventory costs?+
BusCMMS helps organize parts and inventory activity alongside work orders and vehicle maintenance history. That gives fleet teams more context for reviewing parts consumption, stock needs and the maintenance activity driving parts demand.







