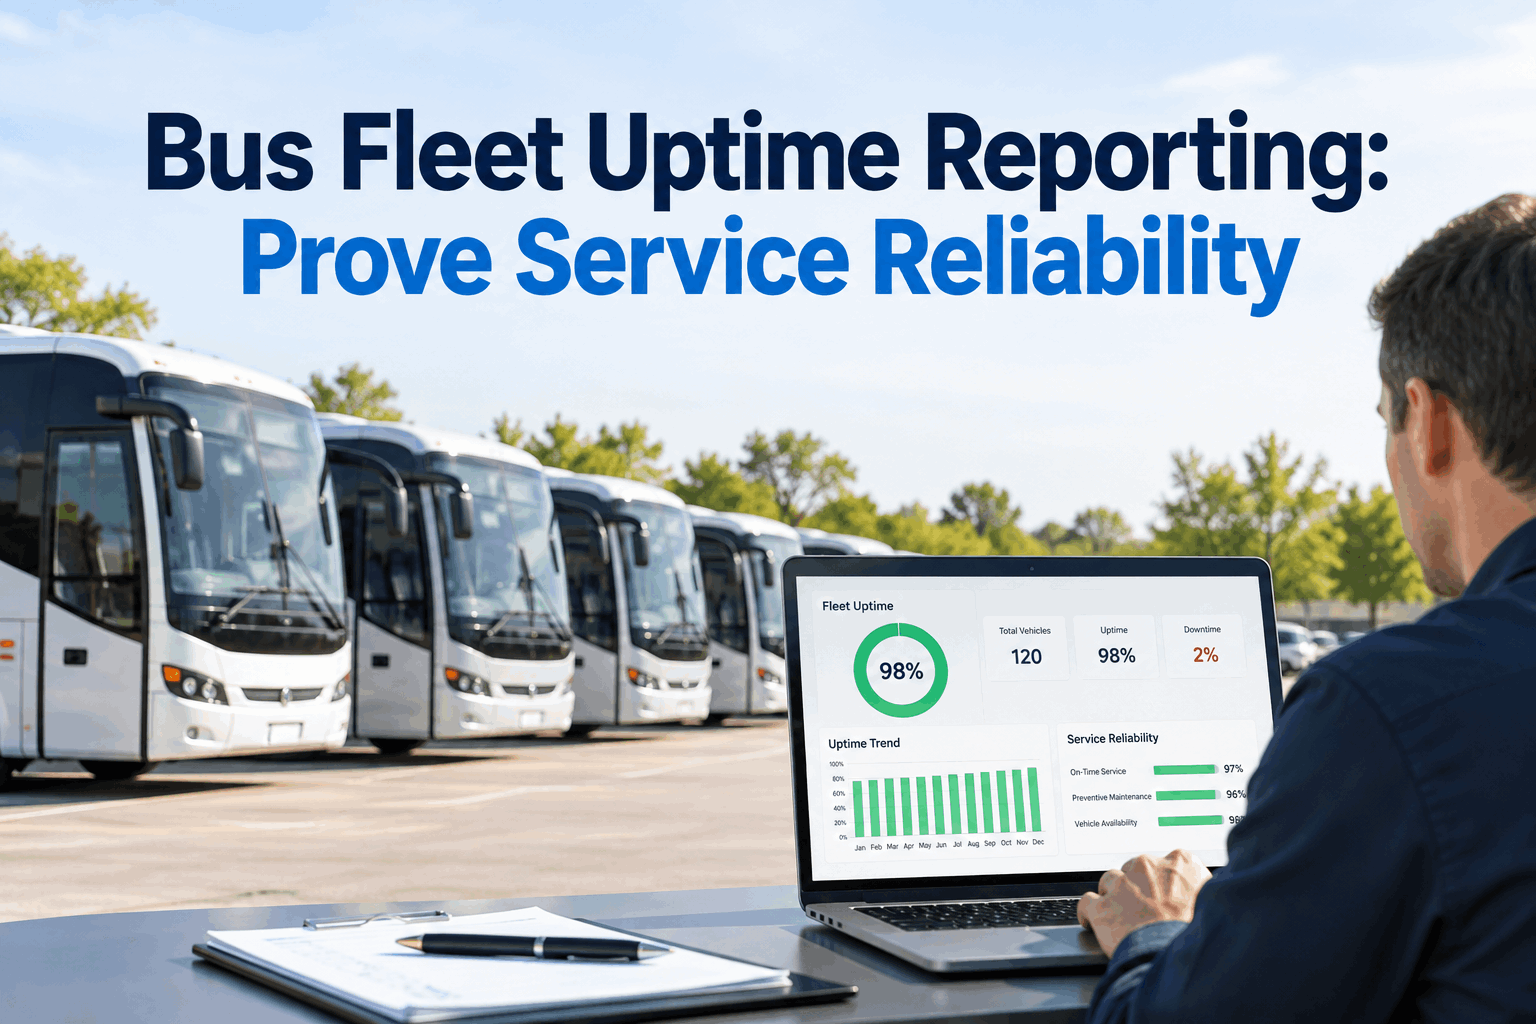
Bus fleet uptime reporting gives clients measurable evidence that vehicles are available when service requires them. Instead of relying on general claims about reliability, fleet operators can track uptime, explain downtime, identify recurring maintenance issues and present performance trends during client and SLA reviews. Clear reporting connects day-to-day fleet maintenance with the service performance promised under the contract.
Don’t Tell Clients the Fleet Is Reliable. Show Them.
Turn uptime, downtime and maintenance activity into a client-ready reliability story that account, operations and contract teams can use during performance and SLA reviews.
Agree on What “Uptime” Means Before You Report a Percentage
Uptime can be calculated differently across contracts and operations. Before presenting a percentage, define the reporting period, which vehicles are in scope, what counts as required service time, how spare vehicles are treated and which downtime events are included. Use the definition written into the contract or SLA when one exists.
Fleet scopeWhich buses count?
Time basisCalendar, service or scheduled hours?
DowntimeWhat starts and stops the clock?
Contract ruleDoes the SLA define the metric?
BusCMMS can help organize maintenance and vehicle records that support reliability reporting. See the BusCMMS reporting workflow.
A Client Needs More Than the Final Uptime Number
Two fleets can post the same uptime percentage and have very different reliability stories. Separate planned maintenance from unplanned downtime, then show the causes behind unplanned events. This helps the client distinguish controlled maintenance activity from breakdowns and recurring reliability problems.
PM · inspection · scheduled repair
Explain timingBreakdown · repeat defect · unscheduled repair
Investigate causeSeparate Vehicle Downtime From Actual Service Disruption
A bus can be unavailable without automatically causing a missed trip if a spare or replacement vehicle protects the service. Client reporting should distinguish vehicle-level downtime from service-level impact whenever the contract requires that distinction. That keeps the reliability discussion tied to both fleet condition and delivered service.
Cooling system repair
Replacement available
No service impact recorded
Fleet reliability: Was the assigned vehicle available?
Service reliability: Was the contracted service delivered?
Keeping maintenance history close to the service-performance conversation makes client explanations more specific. Start building a connected fleet record.
Show Direction, Not Just a Single Month
A monthly uptime figure is a snapshot. A trend shows whether reliability is stable, improving or experiencing repeated pressure. Use the same metric definition across reporting periods and annotate unusual events so clients can understand why a month moved instead of guessing from the percentage alone.
Find the Few Buses Creating Most of the Client Questions
Fleet-wide averages can hide repeated problems on individual vehicles. Rank buses by unplanned downtime, repeat work and recent reliability events. Then open the maintenance history for the exceptions so the client review includes both the performance result and the action being taken.
Turn Downtime Hours Into Corrective Priorities
Reporting becomes more useful when downtime is categorized consistently. A cause map can show whether unavailable time is concentrated in a vehicle system, repeat defect, parts delay, inspection finding or another documented reason. The categories should reflect how your operation records downtime and what the client contract needs to see.
When the cause, repair and vehicle history are connected, an SLA discussion can move from “why was uptime down?” to “here is what happened and what we changed.” See how BusCMMS supports that maintenance trail.
Give Contract Managers a Repeatable Client Review Package
The strongest report is consistent from one review to the next. Build a client package around the metrics the contract actually requires, then add enough maintenance context to explain exceptions without burying the client in shop-level detail.
Uptime, availability and service measures defined by the agreement.
HeadlinePlanned vs unplanned time and documented causes.
ExplainBuses responsible for material reliability events.
FocusWork completed, open items and ownership.
RespondMake the Report Comparable, Traceable and Hard to Misread
Keep uptime logic consistent with the SLA and across reporting periods.
Explain the fleet, service time or vehicle-hours behind the percentage.
Make any contract-approved exclusions visible rather than implicit.
Connect material downtime to maintenance evidence and action.
Metric with definition
Trend with context
Exception with cause
Action with owner
Changing calculation rules
Percentages without scope
Unexplained downtime
Claims without supporting records
A consistent reporting structure also makes internal preparation easier before the client meeting. Start organizing fleet reliability records in BusCMMS.
Move From Score to Exception to Action
What did uptime and service performance show?
How does this period compare?
Which buses drove downtime?
What maintenance evidence explains it?
What changes before the next review?
For fleets that need a clearer reliability story for customers and contract reviews, book a BusCMMS reporting demo.
Client Uptime Reporting Should Explain Performance, Not Just Display a Percentage
Bus fleet uptime reporting is most useful when the metric has a clear definition and the fleet can explain what sits behind it. Track uptime consistently, separate planned and unplanned downtime, distinguish vehicle availability from service impact when appropriate, identify reliability exceptions and connect material events to corrective maintenance. BusCMMS supports that evidence trail by organizing maintenance and vehicle records that fleet owners, account managers and contract teams can use during client and SLA performance reviews.
Uptime, Downtime & Client Reporting Questions
Five practical answers for fleet owners, operations directors, account managers and contract teams.
01What is bus fleet uptime reporting?+
Bus fleet uptime reporting measures and communicates vehicle availability over a defined period. A useful report also explains the calculation scope, downtime events, reliability trends and material exceptions so the client can understand what affected performance.
02How should bus fleet uptime be calculated?+
Use the definition required by the applicable contract or SLA. If no contractual formula exists, document the fleet scope, required availability period, downtime rules and exclusions before calculating the percentage, then apply that method consistently.
03What should a client fleet reliability report include?+
Depending on the agreement, a useful package may include uptime or availability, the metric definition, trend data, planned and unplanned downtime, material vehicle exceptions, service impact and corrective actions. Contract-required measures should take priority.
04Is vehicle uptime the same as service reliability?+
Not necessarily. A vehicle may be unavailable while a spare protects the scheduled service. Vehicle uptime describes asset availability under the chosen definition, while service reliability describes whether required service was delivered under the applicable service measure.
05How does BusCMMS support fleet uptime and SLA reporting?+
BusCMMS helps organize preventive maintenance, inspections, work orders and vehicle maintenance history. Those records provide operational context for investigating downtime and supporting the maintenance evidence used in reliability and client performance reviews.







