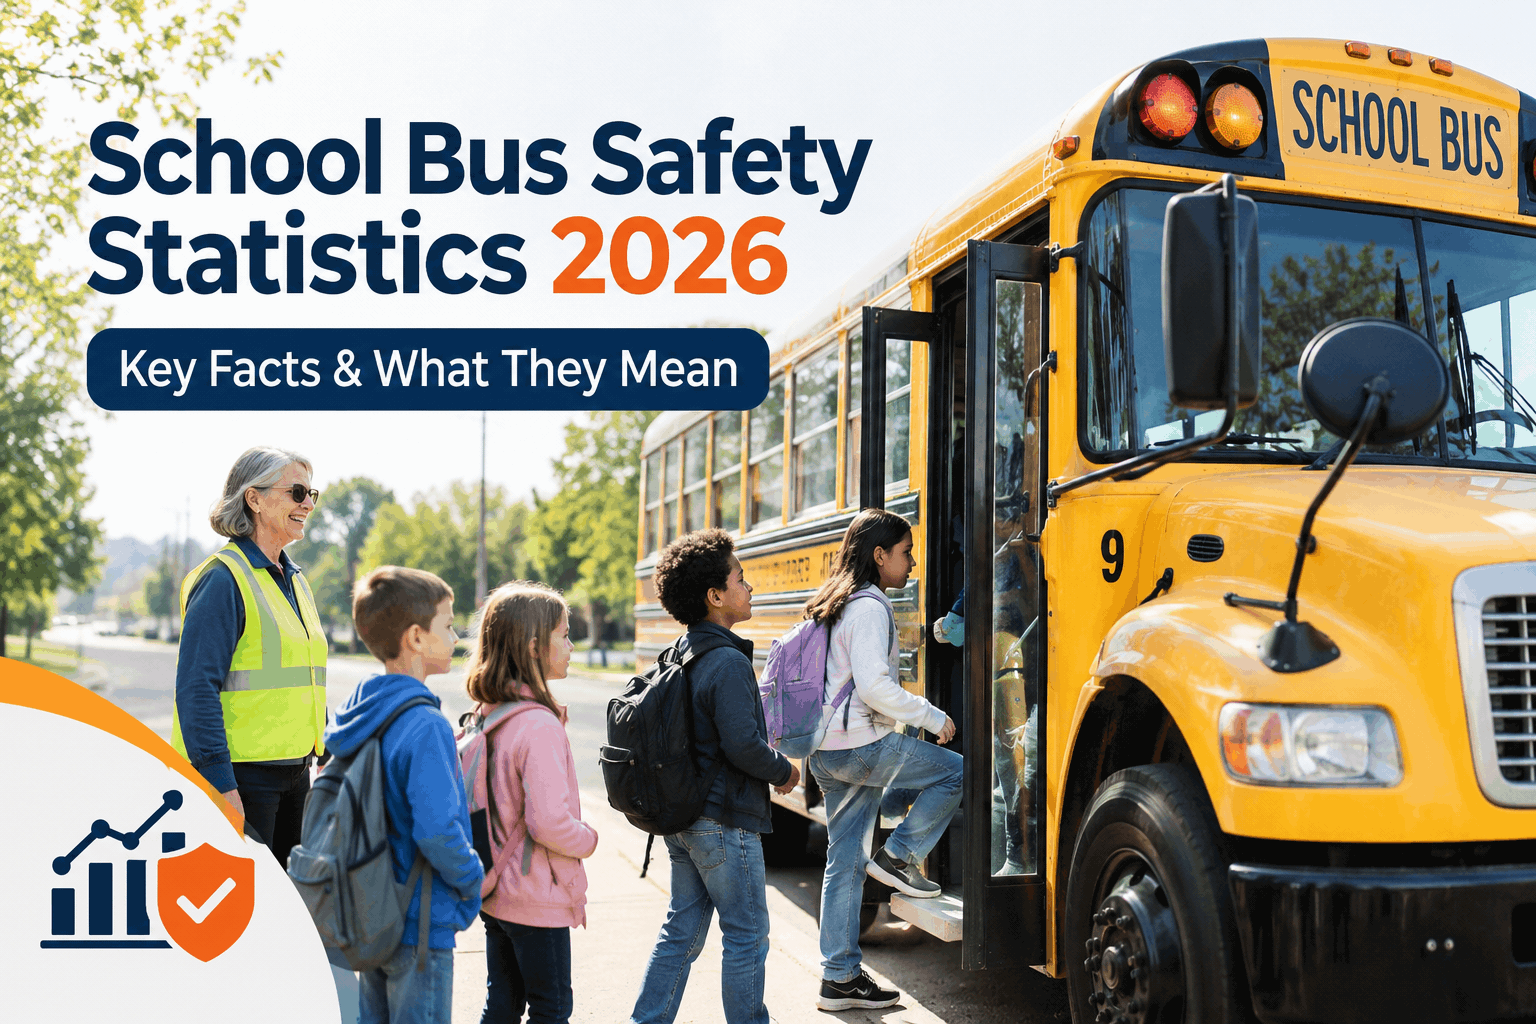
Millions of children board a school bus every school day, and the 2026 federal data confirms it is still by far the safest way to get them to class. But the same numbers carry an uncomfortable truth: the biggest danger to students is not the bus, it is the traffic around it. These school bus safety statistics for 2026 show exactly where to put your attention — see how fleets act on them in a quick demo.
School Bus Safety Statistics 2026: What They Mean
The latest NHTSA and NASDPTS data tells a clear story: school buses are remarkably safe, illegal passing is slowly falling, and the real risk sits outside the bus. Here is what the numbers say — and what to do about them.
Sources: NHTSA School-Transportation-Related Traffic Crashes, 2015-2024 (July 2026); NASDPTS 2026 Illegal Passing Survey.
The Big Picture: School Buses Are Extraordinarily Safe
Start with the headline, because it is genuinely good news. NHTSA's July 2026 review of a full decade of data confirms the school bus remains the safest way to move students — and school-transportation-related crashes are a tiny slice of the national total.
A fraction of all crashes
From 2015 to 2024, school-transportation-related crashes were just about 0.3% of all fatal motor-vehicle crashes in the U.S. — a very small share of the whole.
Far safer than the car ride
Federal analysis puts the school bus far safer per mile than a passenger vehicle — the purpose-built design, height, and visibility all work in a student's favor.
Illegal passing is falling
The 2026 survey marks a second straight annual decline in estimated illegal passings — enforcement and awareness appear to be moving the number.
Over 2015-2024, there were 962 fatal school-transportation-related crashes and 1,069 people killed — an average of about 107 a year, per NHTSA. Tragic, but a small and declining share of U.S. road deaths.
Who Is Actually Getting Hurt — and It's Not Bus Riders
Here is the statistic that should reshape how a fleet thinks about safety. Of the people killed in school-transportation-related crashes, the large majority are not children riding the bus — they are occupants of other vehicles and pedestrians. The bus protects the kids inside it; the danger is outside.
Among pedestrians, the toll falls hardest on the youngest: more than half of school-age pedestrians killed were between 5 and 10 years old, most struck during the morning and afternoon route hours.
The takeaway for a transportation director is direct: the risk concentrates where students cross and board, not in the seats. That is where the bus's own safety equipment earns its keep — you can sign up free and track every stop-arm and light check per bus.
Illegal Passing: Falling, but Still an Epidemic
The single biggest threat to students outside the bus is a motorist illegally passing it. The 2026 NASDPTS survey, built from a one-day national count, projects the annual total — and the trend is finally bending down, even if the absolute number is still staggering.
In a single day of the 2025-26 survey, more than 101,000 drivers in 39 states reported 56,024 illegal passings — and a worrying share happen on the right side, where children board and exit.
The detail inside the survey matters as much as the headline. Projected out, that one-day count becomes an estimated 213,800 illegal passings every school day, with about half on afternoon routes and nearly as many in the morning — the exact windows when the most school-age pedestrians are near the bus. The slow decline is real progress, but a motorist blowing past an extended stop arm is still the single most dangerous moment in a student's trip. The rules on when every driver must stop are universal across all 50 states; our guide to school bus loading and unloading rules by state breaks down the danger zone and the stop law, while this page is the data behind why it matters.
What the Numbers Mean for Your Fleet
Statistics only help if they change what you do. The 2026 data points a fleet toward three concrete priorities — all of them about the equipment and procedures that protect students outside the bus.
Most child fatalities happen outside the bus during loading and unloading. Keep stop arms, crossing gates, and mirrors inspected and working so the warning system never fails at the stop.
You can't control motorists, but you can document violations. Logging each observed passing with date, location, and plate supports enforcement and stands up in audits and civil actions.
The flashing-light and stop-arm warning sequence is the bus's front-line defense at a stop. A burned bulb or slow stop arm is a safety gap — catch it on PM, not on the route.
The data says the bus is safe and the surroundings are not — so a fleet's highest-leverage move is keeping the equipment that guards the danger zone in perfect working order. A demo shows stop-arm and 8-light PM scheduled automatically.
How BusCMMS Turns Safety Data Into Fleet Action
BusCMMS does not change crash statistics — no software does. What it does is keep the bus's own safety equipment working and documented, which is the one part of this picture a fleet fully controls. The 2026 numbers say that equipment matters most exactly where students are most at risk.
Safety-equipment PM
Stop arms, crossing gates, 8-light systems, and mirrors on auto-triggered PM cycles, so a failure surfaces before the route, not during it.
Pre-trip DVIR on safety items
The driver's pre-trip check of lights, stop arm, and mirrors is captured digitally, so a defect becomes a work order instead of a note.
Violation and audit records
Observed passing violations and safety checks logged by date and bus — documentation that supports enforcement and stands up in a DOT audit.
The result is a fleet that has done everything within its control to protect the danger zone — and can prove it. You can sign up free and build your safety-equipment PM in minutes, or book a demo to see it in one place.
A Transportation Director's Take
Key Takeaways from the 2026 Data
The story the 2026 statistics tell is consistent and actionable. Four things to carry into your own fleet.
The bus is the safe part
School buses remain the safest way to transport students, and crashes are a tiny share of road deaths.
The risk is outside
Most fatalities are other-vehicle occupants and pedestrians — the danger concentrates around the bus, not in it.
Illegal passing is falling, slowly
A second straight annual decline to 38.4M — progress, but still an epidemic worth documenting.
Protect the danger zone
Working stop arms, lights, gates, and mirrors are the fleet's highest-leverage, fully-controllable safety move.
Read together, the 2026 school bus safety statistics are reassuring and clarifying at once: the system works, and the place to keep pushing is the stop. Keep the warning equipment flawless, document every check and every violation, and you are doing the part the data says actually moves the needle for students.