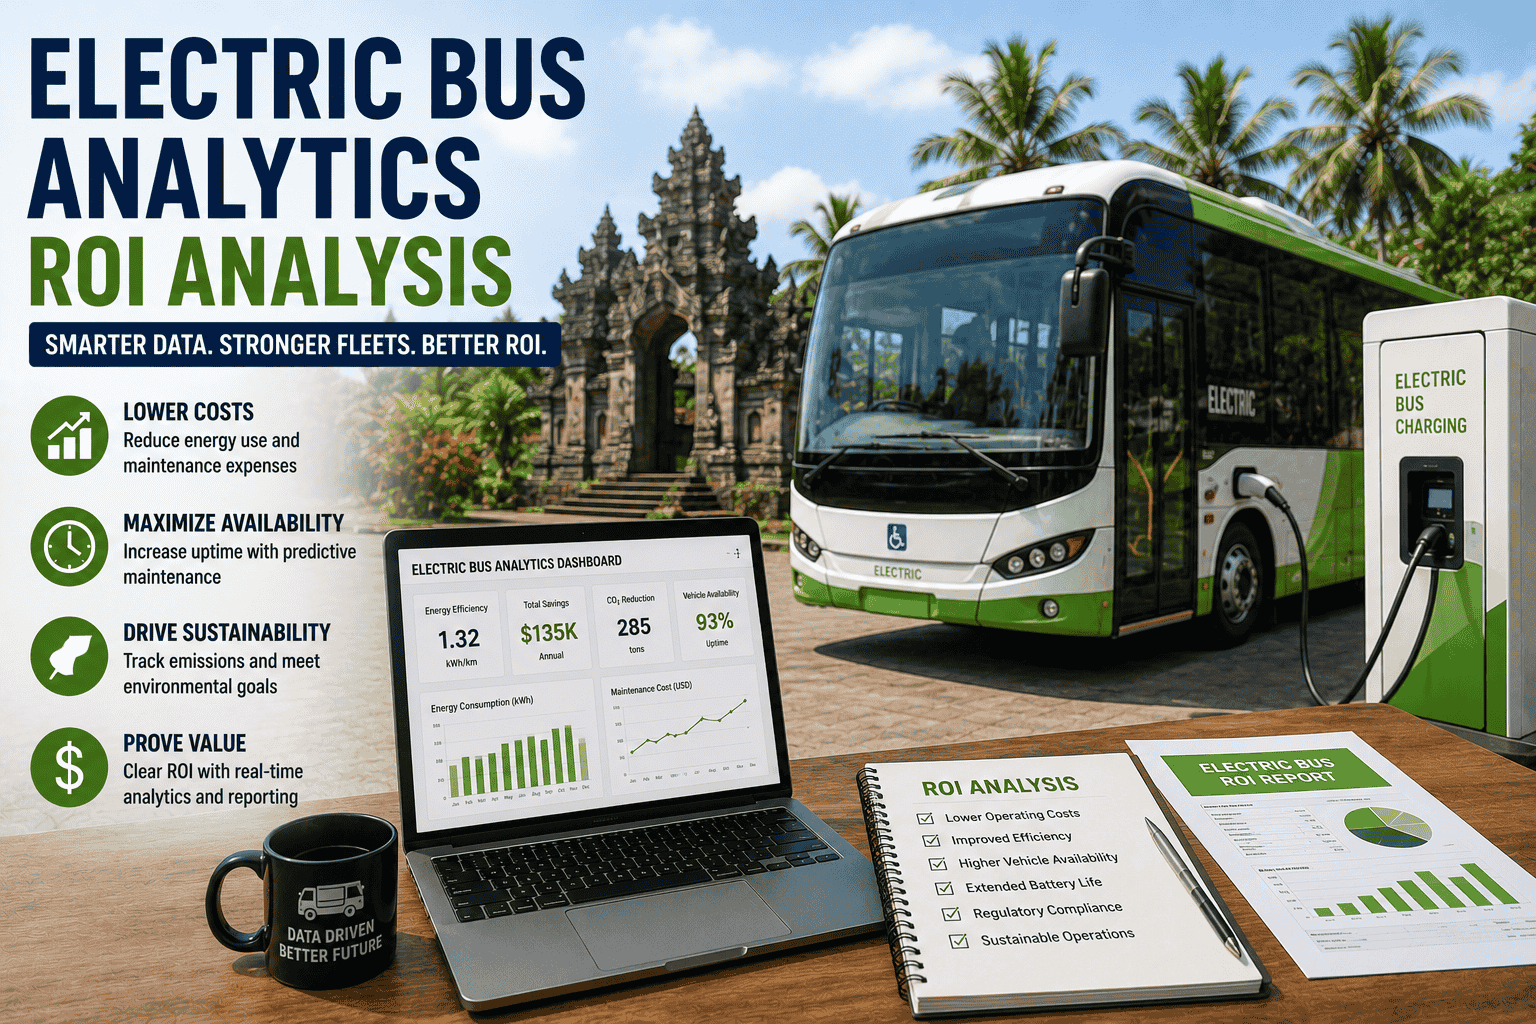
A school district considering a 30-bus electric conversion asked: "What's the ROI?" The superintendent had heard electric buses cost 40% more upfront but save on fuel. Without analytics, she couldn't quantify the actual financial impact across 10 years. A transit authority analyzed their 50-bus electric fleet using analytics: upfront cost premium ($1.2M more than diesel), fuel savings ($200K annually), maintenance savings ($150K annually), battery replacement at year 8 ($800K), and electric infrastructure ($300K). Ten-year net: $850K savings. ROI: 12% annually. The decision became clear: electric buses make sense financially. Analytics transformed the decision from "maybe" to "yes, and here's why." Electric bus adoption accelerates when fleets use analytics to quantify ROI. Hunches aren't enough. Spreadsheets don't capture long-term dynamics. Analytics platforms show cost over time, account for battery replacement, factor in grid integration costs, and compare against diesel baseline with confidence intervals. This guide explains how to use electric bus analytics for ROI analysis and how to communicate results to stakeholders.
Quantify electric bus ROI with real data. See 10-year cost projections, battery lifecycle, and savings vs diesel baseline.
Electric buses cost more upfront (40–50% premium) but save operationally. The real comparison isn't purchase price — it's Total Cost of Ownership (TCO) over the vehicle's lifespan (typically 12 years). TCO includes: purchase price, fuel cost, maintenance, battery replacement, infrastructure, and residual value at end of life. A $450K electric bus vs $320K diesel appears expensive until you add 10 years of $20K annual diesel fuel cost ($200K) plus $10K annual maintenance ($100K). Diesel TCO: $620K. Electric TCO (with battery replacement): $630K. Nearly identical, but electricity costs are lower (electricity cheaper than diesel per mile), and maintenance is dramatically lower (no oil changes, fewer brake repairs due to regenerative braking). Analytics platforms calculate TCO automatically: input purchase prices, fuel rates, maintenance costs, battery replacement cost/timing, infrastructure investment, and electricity rates. The system calculates 10-year and 20-year projections. Sensitivity analysis shows how changes in electricity rates or battery costs affect the calculation. This transparency converts skeptics.
Beyond financial ROI, electric buses deliver operational improvements quantifiable through analytics: uptime (percentage of buses available for service), efficiency (miles per kilowatt-hour), and maintenance frequency. Electric buses show 95–98% uptime vs 88–92% for diesel (fewer breakdown-prone systems). Efficiency varies with route profile, weather, and driver behavior but averages 3.5–4.5 miles/kWh. Maintenance is predictable: scheduled battery health checks, tire rotations, and coolant flushes. Diesel requires oil changes, brake service (higher wear), transmission fluid, and intermittent emergency repairs (unpredictable). Analytics dashboards show: (1) Fleet uptime by bus and route, (2) Energy consumption trend (degradation over years), (3) Maintenance cost per mile (typically 40% lower for electric), (4) Driver efficiency (comparing drivers on same routes). These metrics drive continuous improvement. A driver whose bus consumes 15% more energy than peers might have an aggressive driving style. Coaching improves efficiency. A route showing 20% higher maintenance cost might have problematic road conditions. Route optimization is triggered. Analytics make the invisible visible.
School boards and city councils don't understand kilowatt-hours or regenerative braking. They understand money. Analytics must translate technical details into financial language. A school superintendent cares about: "Does this improve safety?" (yes, instant torque = better acceleration, fewer stalling incidents), "What's the upfront cost?" ($450K per bus, $300K infrastructure for 30-bus fleet = $13.8M), "What's the payback?" (fuel and maintenance savings = $20K per bus annually = $600K fleet savings. Payback = 8–10 years if amortizing infrastructure). "What if electricity prices rise?" (sensitivity analysis shows electric still wins even if electricity costs double). Analytics dashboards communicate this clearly: visual comparison (diesel vs electric cost curves), ROI chart (investment vs payback timeline), risk analysis (showing electric buses resilient to price changes). A 10-minute presentation with good visuals converts councils. A 50-page technical report gets filed unread. Analytics platforms generate executive summaries: "10-year savings $400K, payback 8 years, uptime improvement 5–7%, maintenance cost reduction 40%." That's the message decision-makers need.
Electric bus adoption accelerates when fleets use analytics to quantify ROI. Upfront cost premiums discourage decision-makers until they see 10-year TCO analysis showing competitive or favorable economics. Analytics platforms that calculate TCO, run sensitivity analysis, track operational metrics (uptime, efficiency, maintenance), and generate executive summaries are essential for electric bus business cases. Numbers drive decisions. Hunches don't.
Electric bus ROI analysis requires Total Cost of Ownership (TCO) comparison vs diesel baseline over 10–12 year lifespan. Upfront cost premium ($130K per bus) is offset by fuel savings ($200K per bus over 10 years) and maintenance savings ($100K per bus over 10 years). Battery replacement at year 8 adds cost but is outweighed by operational savings. Analytics platforms calculate TCO automatically, run sensitivity analysis (how changes in fuel/electricity prices affect ROI), and track operational metrics (uptime, efficiency, maintenance). Decision-makers need executive summaries showing payback period, 10-year savings, and uptime improvements in clear language. Analytics transform "maybe" into "yes" by making the financial case transparent.







