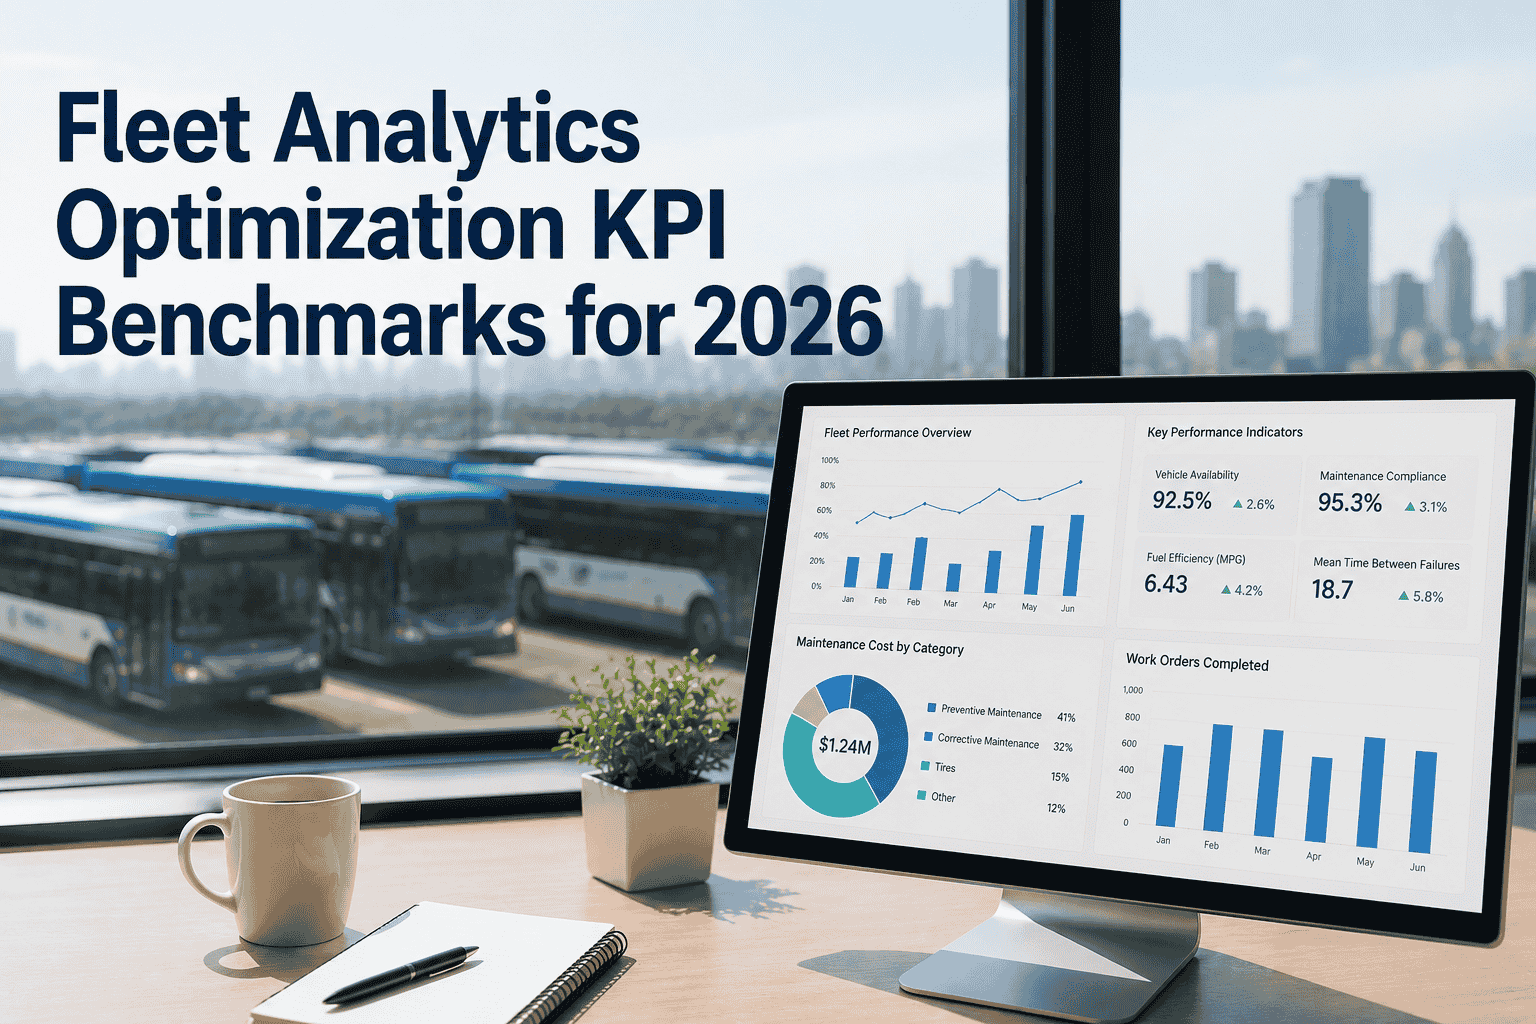
A regional transit authority running 150 vehicles collected millions of data points every week but had no way to translate them into action. They tracked maintenance, fuel, and breakdowns in siloed systems, leaving management blind to operational trends. The result: a 14% increase in year-over-year operating costs, an average breakdown rate of 4.2 per 10,000 miles, and a fluctuating fleet availability rate that disrupted daily scheduling. After implementing a unified fleet analytics optimization framework, the agency aggregated their performance data into real-time key performance indicators (KPIs). Within six months, preventive maintenance compliance hit 98%, breakdown frequencies dropped by 60%, and vehicle availability stabilized at an optimal 95%. Fleet analytics optimization isn't about collecting more data points. It's about standardizing data to make immediate, cost-saving operational decisions. Here is how leading fleets manage their analytical benchmarks to answer performance questions before bottlenecks emerge.
Fleet Analytics Optimization KPI Benchmarks Guide
Turn raw vehicle data into actionable operational benchmarks. Eliminate blind spots, cut emergency repair costs, and maximize fleet uptime.
Most fleet managers suffer from data overload rather than a lack of information. They review stacks of disjointed driver vehicle inspection reports (DVIRs), parts slips, and fuel receipts every month, but fail to extract actionable intelligence. This is reactive data hoarding. True fleet analytics optimization maps everyday information directly to three essential performance categories: vehicle availability, cost metrics, and life-cycle predictability. By unifying parts tracking, maintenance metrics, and real-time fault tracking into one centralized dashboard, you move away from uncoordinated troubleshooting. Instead of examining why a single bus broke down on a route, optimized data highlights why a specific engine sub-component across 15 vehicles is failing 12% earlier than standard manufacturer forecasts. Benchmarking changes your mindset from measuring failure to systematically engineering reliability.
To evaluate efficiency accurately, modern fleet operations track three primary benchmarks. First: **Preventive Maintenance Compliance (PMC)**. This tracks the percentage of scheduled maintenance items completed within your strict target windows. Any rating below 90% indicates a bottleneck in garage workflows or parts readiness. Second: **Mean Time Between Failures (MTBF)**. This measures the distance or time a vehicle travels before an unscheduled breakdown removes it from service. Maximizing MTBF directly reduces your emergency towing bills. Third: **Fleet Availability Rate**. This represents the exact percentage of your fleet ready for service at any given time. Siloed management structures struggle to maintain stability across these values because their workflows are disconnected. Connecting your DVIR digital inputs to your inventory reorder rules creates a continuous feedback loop that protects these metrics automatically.
A mid-sized student transportation fleet with 110 buses configured an analytics tracking matrix to address an influx of cooling system issues. Rather than managing repairs as isolated incidents, the system correlated mileage intervals, component providers, and technician diagnostic codes. The analytical models flagged a specific batch of water pumps that were failing 30,000 miles before their expected life cycle. By replacing those units during standard garage visits, the group eliminated roadside failures and saved $43,000 in emergency repairs. Similarly, a regional transit system applied route-by-route efficiency analysis to its city lines. The system identified four heavily congested routes that caused accelerated brake wear and excessive fuel consumption. Adjusting vehicle assignments on those lines lowered annual fleet component costs by $31,000.
Deploying a comprehensive analytics optimization platform does not require rebuilding your garage workflows from scratch. A structured rollout keeps implementation straightforward. The first 30 days focus on data integration, connecting existing fuel trackers and digital inspection inputs into a central dashboard. The second month concentrates on setting your specific performance alerts and training staff to interpret dashboard indicators. The final month applies auto-scheduling functions, ensuring that whenever a metric dips below its specified threshold, a diagnostic work order generates instantly. This approach minimizes setup complications and establishes clear, long-term operational visibility.
Relying on scattered spreadsheets and unstructured data creates artificial operational limits. Transitioning to an optimized fleet analytics platform lets you track vehicle availability, mean time between failures, and component lifespans in real time. Rather than reacting to unexpected engine breakdowns on busy routes, analytics dashboards spot trend anomalies early. This enables simple shop fixes that avoid expensive on-road breakdowns. A standard 150-vehicle fleet typically trims maintenance overhead by 12–18% within months of centralization. Streamlining data inputs is the fastest, most effective way to protect asset value and verify fleet performance to external stakeholders. BusCMMS provides the backend analytics tools needed to centralize tracking, calculate custom benchmarks, flag metric anomalies, and create automated shop orders inside a single system.







