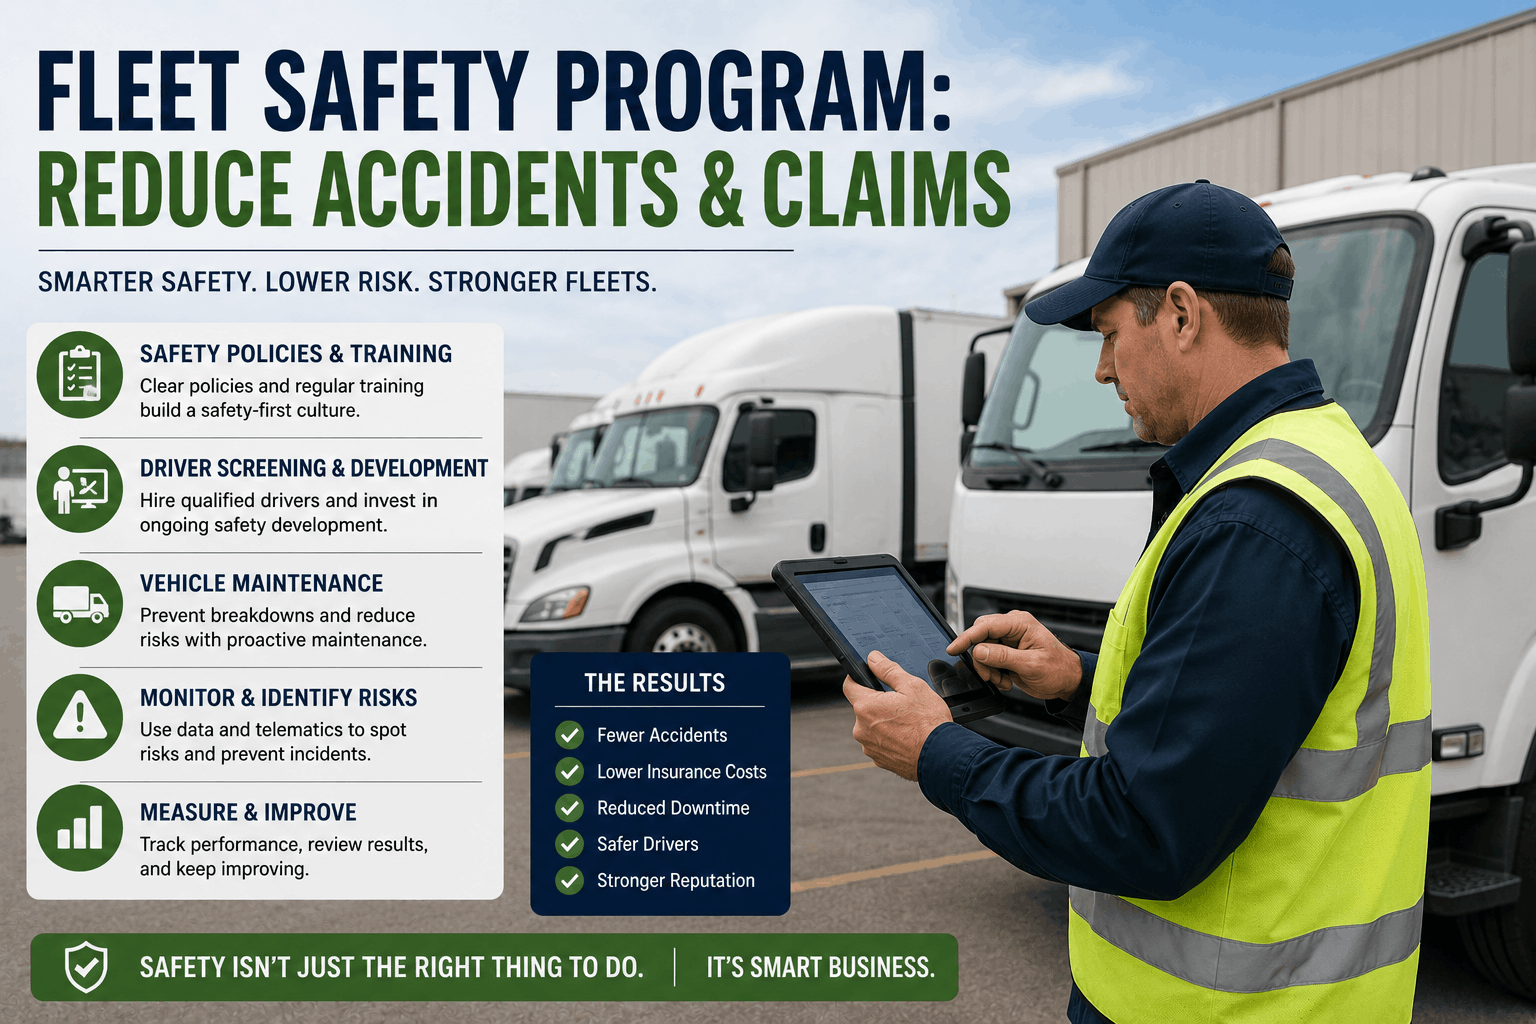
Fleet accidents cost $70,000–$200,000+ each including: vehicle damage, driver injuries, third-party claims, increased insurance, downtime. A fleet with 10 preventable accidents per year loses $700,000–$2M to accidents alone. A fleet with a systematic safety program cuts accidents 40–60%. That's $280K–$1.2M in savings per year. Safety programs also reduce insurance premiums 15–25%. A small investment in training, telematics, and policies returns massive ROI. This guide covers building a fleet safety program: policies, driver training, telematics monitoring, incident response, and how to measure improvement.
Accidents cost millions. Learn how to build a safety program that reduces crashes 40–60% and cuts insurance premiums.
1. Establishing a Zero-Tolerance Fleet Safety Policy
A safety program is only as strong as its core policy guidelines. Fleets must transition from reactive handling to strict, contractually binding driver agreements that establish clear boundaries before a vehicle ever shifts into drive.
MVR Pre-Screening Standards
Implement quarterly Motor Vehicle Record sweeps. Establish a strict point system for moving violations, at-fault accidents, and active driver risk.
Distracted Driving Zero-Tolerance
Define a zero-tolerance policy for mobile phone usage, including holding a device while idling at traffic lights.
Seatbelt & Cabin Protocols
Require 100% seatbelt compliance for drivers and helpers during every route, stop, and short-distance movement.
2. Leveraging Telematics & Real-Time Driver Coaching
Modern fleet tracking has advanced far beyond basic GPS coordinates. Fleet managers can use real-time onboard telemetry to identify and correct risky behaviors before they result in a claim.
Configuring High-G Event Thresholds: Program your telematics platform to log hard braking, rapid acceleration, and aggressive cornering.
AI-Powered Dashcam Integration: Deploy dual-facing camera setups to detect fatigue, distraction, and unsafe driver behavior.
Peer Scorecards & Gamification: Generate weekly driver safety leaderboards and reward top-performing safe operators.
3. Post-Accident Investigation & Incident Response
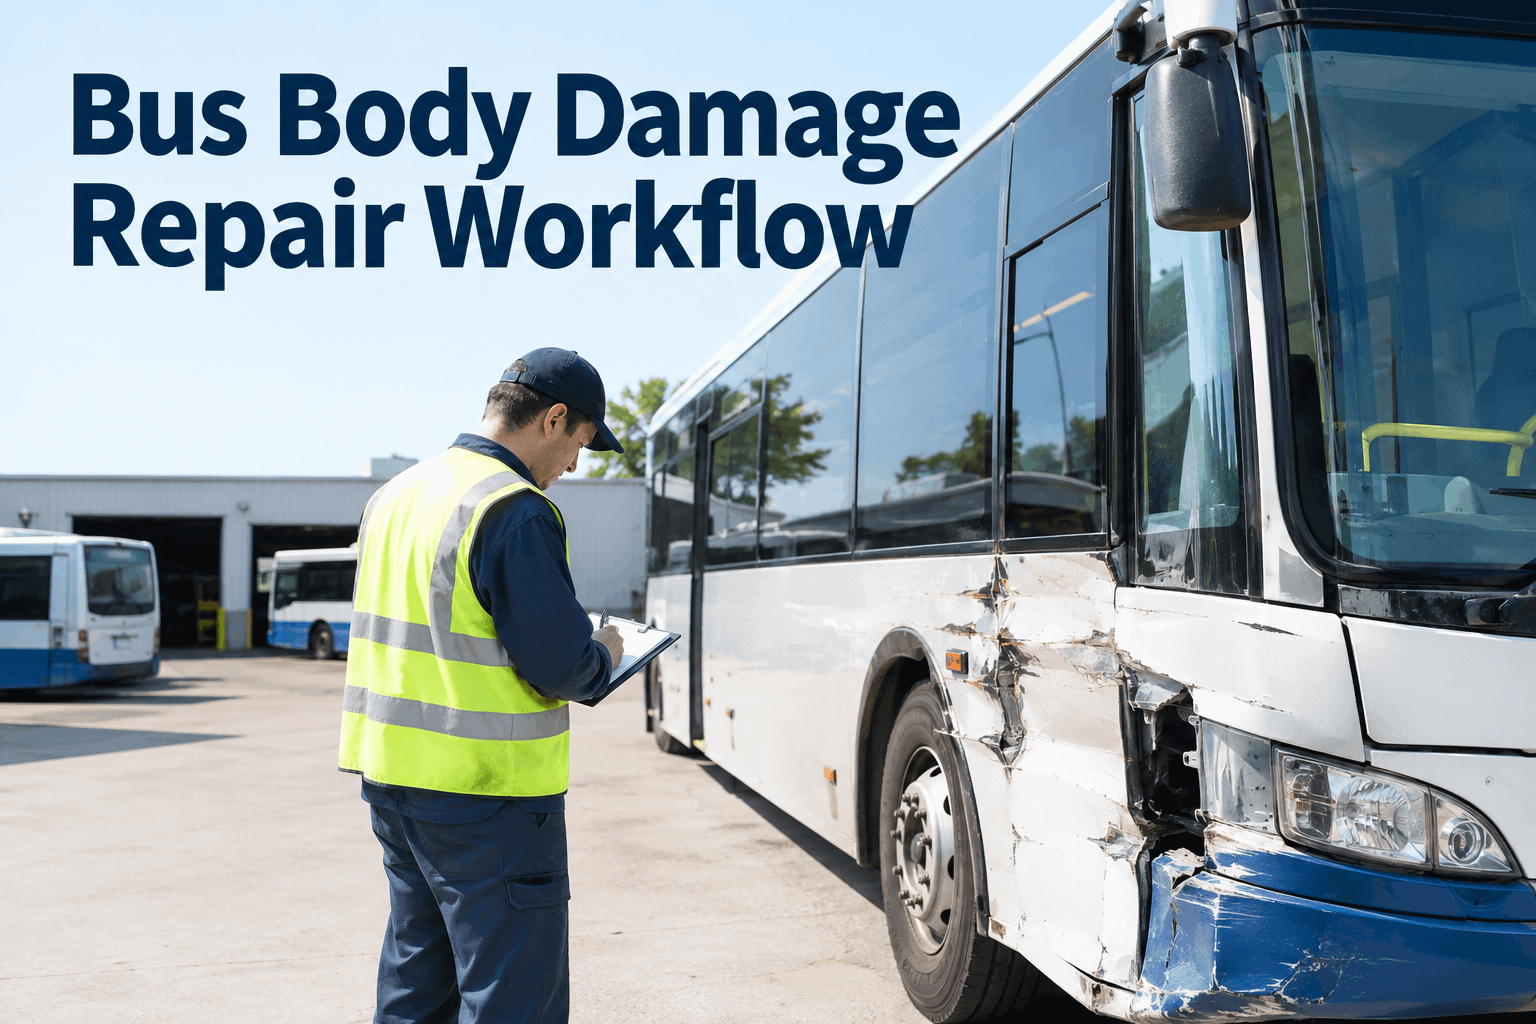
When a collision occurs, the immediate actions taken by the operator and dispatch desk directly affect the legal and financial liability of the organization.
| Response Phase | Target Window | Critical Action |
|---|---|---|
| Scene Preservation | Minutes 1–15 | Confirm driver safety, secure the area, document conditions, and collect high-resolution photos. |
| Drug Testing | Hours 2–8 | Initiate required post-accident testing when the crash meets regulatory thresholds. |
| Root-Cause Review | Within 48 Hours | Review vehicle data, camera evidence, route conditions, and driver statements to identify the root cause. |
4. Financial Breakdown: Cost vs. Safety Program Savings
Building a safety framework requires software, camera hardware, training time, and policy enforcement. However, the savings can quickly exceed the initial investment.
| Operating Expense Segment | Before Safety Framework | After Safety Framework | Net Savings |
|---|---|---|---|
| Commercial Auto Liability Premiums | $185,000 | $148,000 | $37,000 |
| Physical Damage / Deductibles | $110,000 | $44,000 | $66,000 |
| Third-Party Claims | $240,000 | $0 | $240,000 |
| Vehicle Downtime Costs | $55,000 | $18,000 | $37,000 |
| Total Annual Risk Cost | $590,000 | $228,000 | $362,000 |