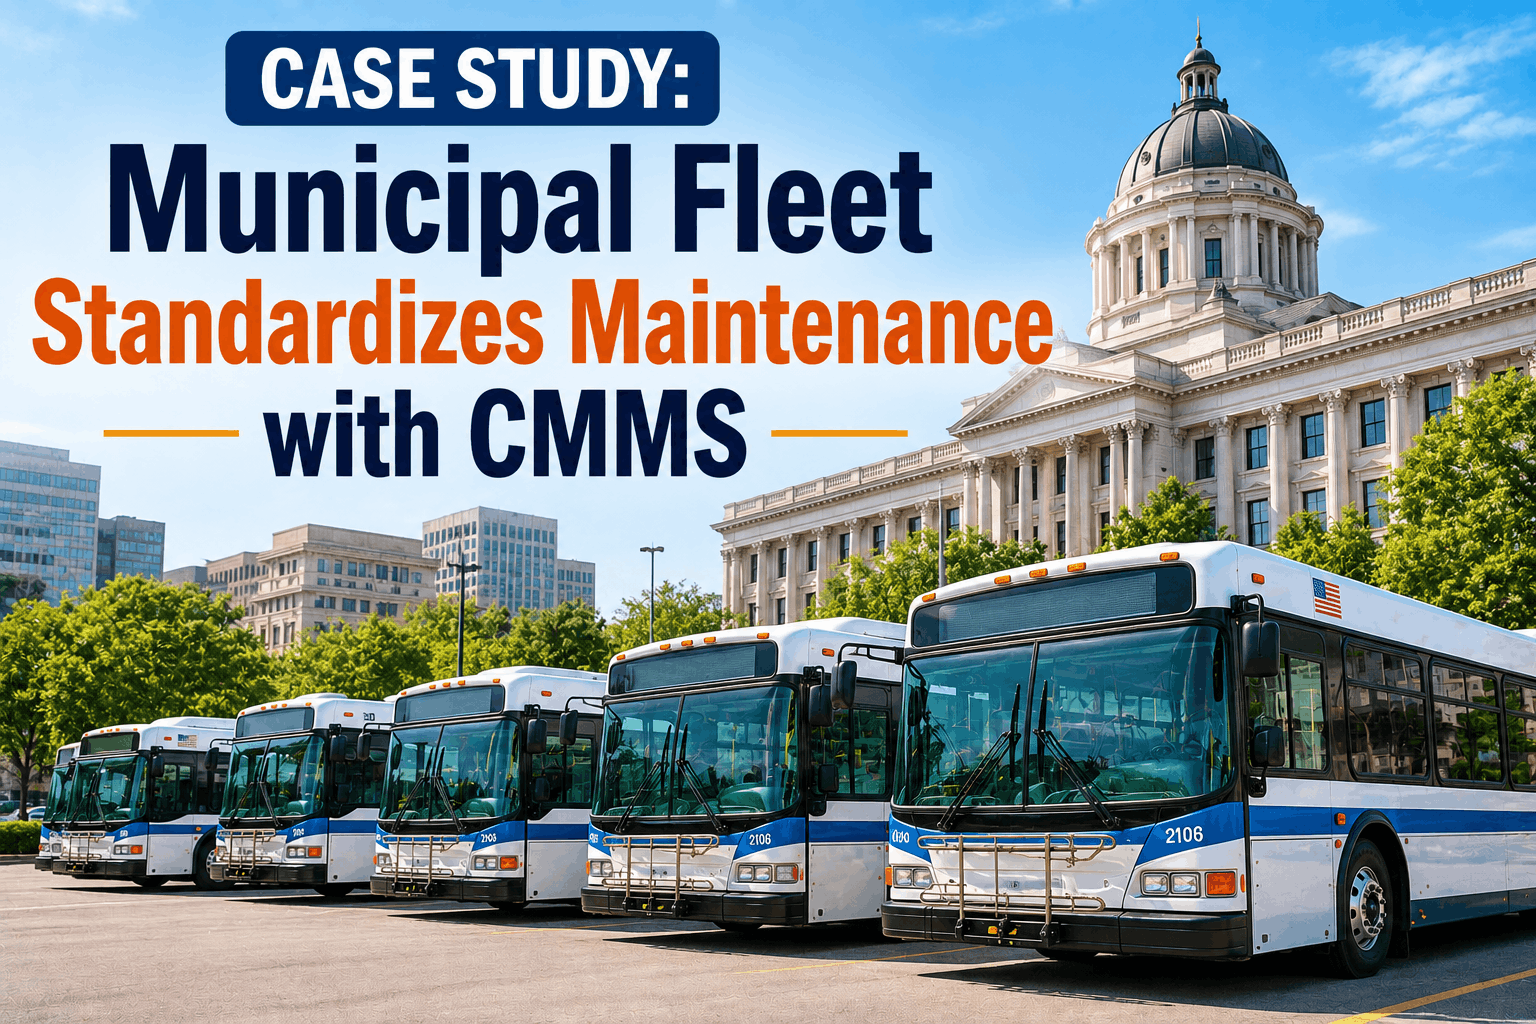
A mid-size city operated 85 buses across multiple transit lines, supported by maintenance facilities managing both buses and support vehicles. Maintenance records were scattered across systems, spreadsheets, and manual files. Budget forecasting was difficult, audits took weeks, and teams lacked visibility into spending by vehicle type or maintenance category. This case study shows how a municipal fleet standardized maintenance on one CMMS platform and gained control over operations, costs, and compliance.
A city consolidated bus and support-vehicle maintenance onto one platform, gaining budget visibility and audit-ready records.
Fragmented operations: Bus maintenance, support vehicle maintenance, and equipment tracking were managed across separate systems and locations. Staff had to search multiple places to find service history or repair status.
Budget visibility gaps: The city spent roughly $3.2 million annually on fleet maintenance but could not easily break costs down by vehicle type, facility, repair category, or recurring failure pattern.
Audit pressure: Annual safety audits required documentation from multiple locations. Preparing reports took 3-4 weeks, and documentation gaps created compliance risk.
Operational inefficiency: Mechanics wasted time searching records, supervisors lacked complete PM visibility, and finance teams had to rely on estimates instead of real-time maintenance data.
Unified CMMS platform: The city selected a cloud-based CMMS that could manage buses, support vehicles, equipment, work orders, inspections, purchase orders, parts, and reporting from one system.
Data migration: Five years of maintenance history were cleaned, standardized, and migrated. Vehicle IDs, work order categories, cost codes, and inspection records were aligned across departments.
Workflow standardization: The city created consistent maintenance procedures for all facilities, including PM scheduling, work order approval, parts usage, vendor tracking, and inspection documentation.
Role-based training: Mechanics learned mobile work orders, supervisors learned scheduling and reporting, finance teams learned cost tracking, and managers learned analytics dashboards.
Budget visibility improved: Within 6 months, the city could view spending by vehicle type, facility, maintenance category, and asset. This helped leadership identify brake maintenance, tires, and fluid services as major cost drivers.
Annual savings reached $280,000: Savings came from better vendor pricing, optimized preventive maintenance, reduced emergency repairs, improved parts planning, and lower administrative effort.
Audit preparation dropped from weeks to days: Reports that previously required manual searching could now be generated quickly with complete vehicle history and inspection records.
Mechanic administrative time fell 15%: Mechanics spent less time searching records and more time completing repairs because work order history, parts usage, and inspection notes were available digitally.
Mean time between failures increased 22%: With better history and PM planning, the city replaced high-risk components before failures caused service disruption.
Compliance confidence improved: The most recent audit was completed with zero findings, supported by complete documentation and consistent maintenance records.
Moving old records without cleaning vehicle IDs, cost codes, and duplicate entries can make reports unreliable from day one.
Many agencies focus only on buses while vans, pickups, trailers, and equipment remain on spreadsheets, keeping operations fragmented.
Mechanics, supervisors, finance users, and directors need different workflows. Generic training lowers adoption.
Audit readiness should be built daily through complete digital records, not rushed together weeks before inspection.
| Metric | Before | After | Change |
|---|---|---|---|
| Annual maintenance cost visibility | Limited | Complete | 100% improvement |
| Budget forecasting accuracy | 60-70% | 90-95% | +25-30% |
| Audit preparation time | 3-4 weeks | 2-3 days | -85% |
| Mechanic administrative time | 100% | 85% | -15% |
| Mean time between failures | Baseline | +22% | +22% |
| Annual maintenance cost | $3.20M | $2.92M | -$280K |
| Audit findings | 12-15 annually | 0 | 100% compliance |







