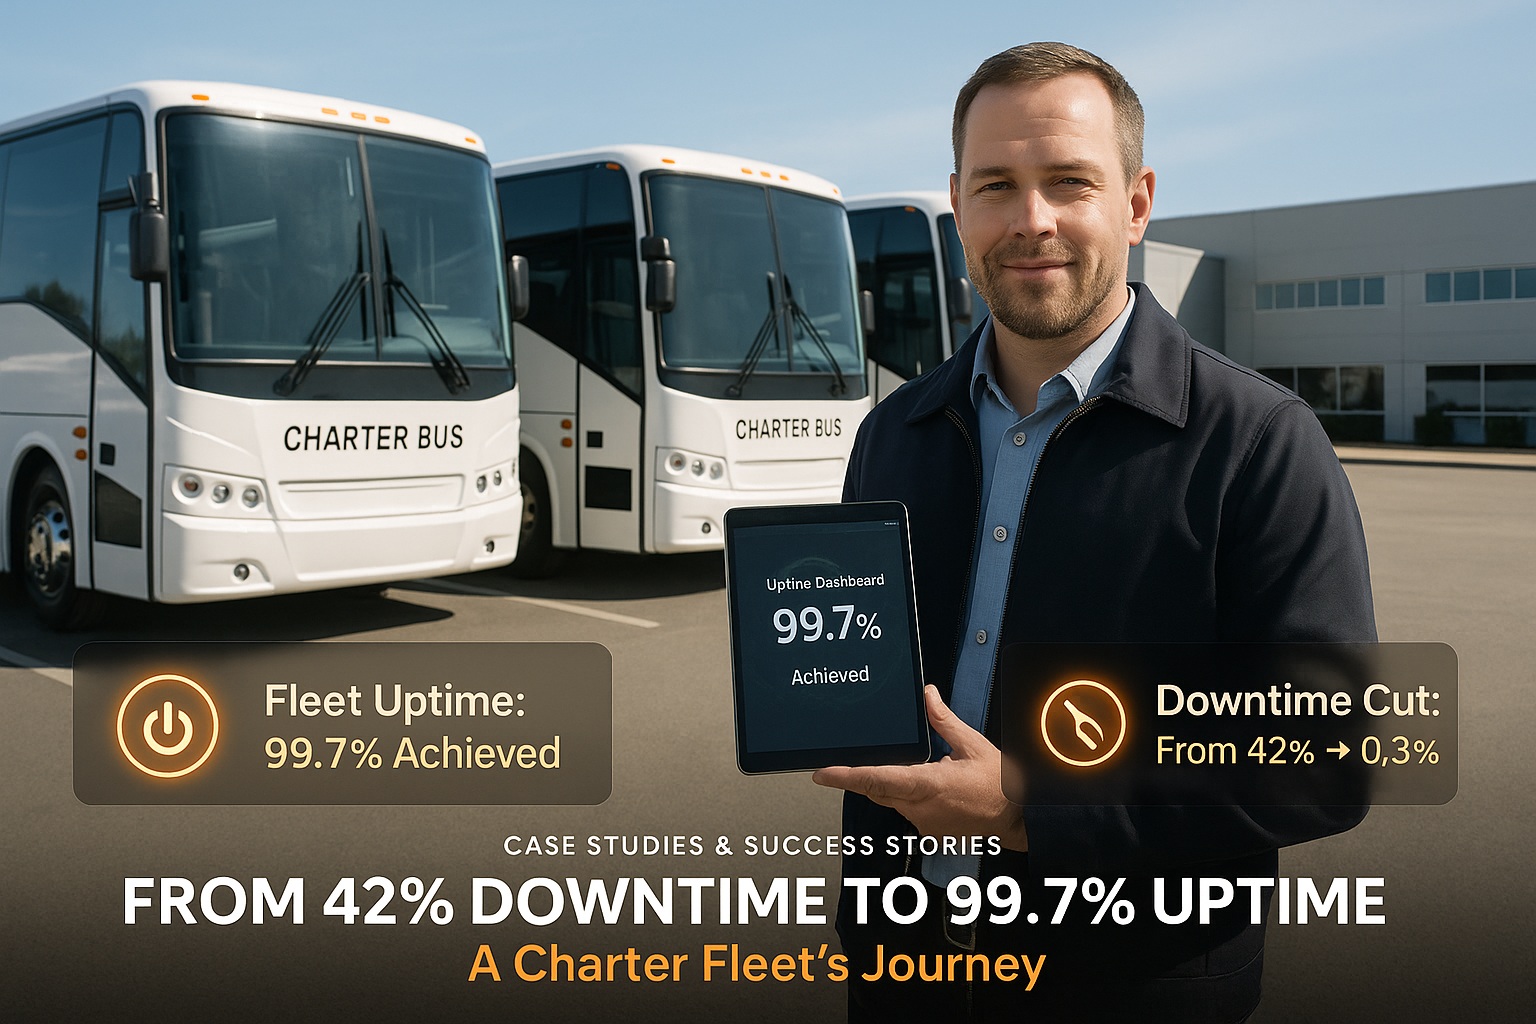
When Marcus Thompson took over as Operations Director at Southeast Regional Charter in early 2023, the 38-bus fleet was hemorrhaging money. Nearly half the fleet sat idle on any given day—not from lack of bookings, but from maintenance failures. Eighteen months later, that same fleet operates at 99.7% availability. This is the story of how they got there.
What Was the Fleet's Starting Point?
Southeast Regional Charter operates primarily in Georgia, Alabama, and Florida, serving corporate accounts, school athletics, church groups, and tourism operators. The fleet includes 24 MCI J4500 motorcoaches (56 passengers), 8 Van Hool CX45 coaches, and 6 Prevost H3-45 units. Average fleet age: 7.2 years.
Before the transformation, the operation was typical of struggling regional charter companies. Maintenance decisions happened reactively. When a bus broke down, someone figured out how to fix it. Parts were ordered when needed, not before. Inspection records lived in filing cabinets—when they existed at all.
The Numbers That Triggered Change
The breaking point came in March 2023. A 4-bus corporate contract—worth $2,400 per day—had to be subcontracted to a competitor when three buses failed pre-trip inspections and the fourth broke down en route. The client never rebooked.
What Caused the 42% Downtime Problem?
An honest assessment revealed interconnected failures across every aspect of maintenance operations. Understanding these root causes was essential before selecting any solution.
Reactive Maintenance Culture
The maintenance team operated in permanent crisis mode. With no scheduled maintenance system, technicians spent 73% of their time on emergency repairs rather than preventive work. A single roadside breakdown could consume an entire day—the tow, the diagnosis, the emergency parts run, the repair, and the return to service.
Zero Maintenance History
When a bus entered the shop, technicians had no reliable record of previous repairs, parts installed, or recurring issues. The same alternator might be replaced three times in a year because nobody knew it had already failed twice. Component failure patterns—which could predict future failures—were invisible.
Parts Inventory Chaos
The parts room was a $127,000 graveyard of obsolete components mixed with critical shortage items. Technicians would discover missing brake pads only after a bus was on the lift. Emergency orders with overnight shipping had become routine, adding 40-60% markup on parts costs.
Inconsistent Inspections
Pre-trip inspections happened—when drivers remembered. Post-trip inspections were rare. DOT inspection compliance was managed through last-minute cramming rather than systematic scheduling. Two buses had expired inspections discovered during a surprise audit.
Struggling with fleet availability? See how CMMS transforms charter operations from reactive chaos to predictable reliability.
Getting Started Book a DemoHow Did the Transformation Begin?
After evaluating six maintenance management platforms, Southeast Regional selected a CMMS designed specifically for bus fleet operations. The decision factors: bus-specific inspection templates, integration with their fuel management system, mobile capabilities for drivers, and a pricing model appropriate for mid-sized fleets.
Implementation followed a phased approach designed to build momentum through quick wins while systematically addressing root causes.
Phase 1: Foundation (Months 1-2)
Focus: Data Migration and Basic Setup
- Complete asset inventory: 38 buses with 2,400+ component records
- VIN decode for accurate manufacturer specifications
- User accounts for 6 technicians, 24 drivers, 3 managers
- Basic PM schedules based on manufacturer recommendations
- DOT inspection schedule integration
Result: First PM work orders generated automatically by end of month 2
Phase 2: Process Change (Months 3-4)
Focus: Workflow Integration
- Digital pre-trip inspections mandatory for all departures
- Defect-to-work-order automation (driver reports become repair tickets)
- Parts inventory baseline with reorder points established
- Mobile app deployed to all drivers and technicians
- Daily shop meeting using CMMS dashboard
Result: Fleet availability increased from 42% to 68% by end of month 4
Phase 3: Optimization (Months 5-8)
Focus: Data-Driven Decisions
- Fuel system integration for mileage-based PM triggers
- Component failure analysis identifying problem patterns
- Vendor scorecards tracking parts quality and delivery
- Technician productivity tracking and labor optimization
- Custom reports for management KPIs
Result: Fleet availability reached 89% with break-even on implementation costs
Phase 4: Excellence (Months 9-18)
Focus: Predictive Capabilities
- Predictive alerts based on historical failure patterns
- Seasonal maintenance planning for peak demand periods
- Multi-year capital planning using component lifecycle data
- Continuous improvement cycles based on KPI trends
- Integration with booking system for maintenance windows
Result: Fleet availability stabilized at 99.7% with full ROI achieved
What Specific Changes Made the Biggest Impact?
While the full transformation required systematic improvement across all areas, certain changes delivered outsized results. These five interventions accounted for roughly 70% of the availability improvement.
Inspection Compliance Automation
Impact: 34% of total improvement
Mandatory digital pre-trip inspections with photo documentation transformed driver behavior. Buses couldn't be dispatched without completed inspections. Small issues—fluid levels, tire pressure, minor leaks—were caught before becoming roadside emergencies. The average defect was now identified 12 days earlier than before.
Preventive Maintenance Scheduling
Impact: 28% of total improvement
Automated PM scheduling based on both mileage and calendar intervals ensured nothing was missed. The system scheduled maintenance during natural gaps in the booking calendar. PM compliance went from an estimated 45% to 97%. Emergency repairs dropped by 71%.
Parts Inventory Optimization
Impact: 19% of total improvement
Reorder point automation eliminated both stockouts and excess inventory. Critical items—filters, belts, brake components—stayed in stock. Obsolete parts were liquidated. Emergency orders dropped from 67% to 8% of purchases. Parts carrying costs decreased 34% while availability increased.
Component Failure Pattern Analysis
Impact: 12% of total improvement
After six months of data collection, patterns emerged. Certain alternators consistently failed at 85,000 miles—replacement at 80,000 miles prevented failures. Air conditioning compressors showed stress indicators weeks before failure. Predictive replacement eliminated 14 potential roadside breakdowns in year two.
Technician Workflow Efficiency
Impact: 7% of total improvement
Digital work orders with parts pre-staged reduced repair time by 23%. Technicians spent less time hunting for parts or paperwork and more time turning wrenches. Wrench time increased from 58% to 76%. The same team now maintained more buses with higher quality.
What Were the Financial Results?
The transformation delivered measurable financial returns across multiple categories. Here's the detailed breakdown after 18 months of operation.
| Category | Before CMMS | After CMMS | Annual Impact |
|---|---|---|---|
| Fleet Availability | 42% (16 buses) | 99.7% (38 buses) | +22 buses available daily |
| Lost Revenue (Downtime) | $743,000/year | $18,400/year | +$724,600 recovered |
| Emergency Repairs | $312,000/year | $47,000/year | +$265,000 saved |
| Parts Inventory Costs | $127,000 carrying | $84,000 carrying | +$43,000 saved |
| Rush Shipping Charges | $38,000/year | $4,200/year | +$33,800 saved |
| Subcontractor Costs | $89,000/year | $12,000/year | +$77,000 saved |
| Roadside Assistance Calls | 23 annually | 2 annually | +$31,500 saved |
| Total Annual Benefit | $1,174,900 | ||
Return on Investment Summary
Calculate your fleet's potential savings. Most charter operators see 8-12 month payback on CMMS investment.
Getting Started Book a DemoWhat Challenges Did the Team Face?
The transformation wasn't smooth. Several significant challenges required creative solutions and persistent leadership.
Challenge 1: Driver Resistance to Digital Inspections
Veteran drivers initially resisted mandatory digital pre-trip inspections. "I've been doing this 20 years—I don't need a phone to tell me if a bus is safe." The solution combined policy enforcement with genuine driver input. Drivers helped design the inspection checklist, making it practical rather than bureaucratic. Within three months, most drivers appreciated how the system documented their diligence and protected them from blame when issues arose.
Challenge 2: Data Entry Burden During Transition
The first 60 days required significant data entry—building asset records, entering parts inventory, establishing maintenance histories. The maintenance team worked overtime. To manage this, the company hired two temporary workers specifically for data entry and extended the implementation timeline by three weeks. The investment in accurate baseline data paid dividends in system reliability.
Challenge 3: Integration with Existing Fuel System
The fleet's fuel management system used proprietary data formats that didn't match the CMMS import requirements. A custom integration required 40 hours of IT consulting. The result—automatic mileage updates triggering PM schedules—was worth the investment but added unexpected costs and delays.
Challenge 4: Maintaining Momentum During Slow Months
Winter months brought reduced bookings and a temptation to relax the new processes. Leadership used this period strategically—catching up on deferred maintenance while reinforcing system habits. When spring demand returned, the fleet was ready with 100% availability rather than the usual scramble.
What Lessons Can Other Fleets Apply?
Marcus Thompson shared five key lessons from the transformation that apply to charter fleets of any size.
Lesson 1
Start with Inspections
Digital pre-trip inspections delivered the fastest ROI and built system credibility. When drivers saw their reported issues generating work orders and getting fixed, they trusted the system. Start here for quick wins that build momentum.
Lesson 2
Invest in Data Quality
Garbage data produces garbage insights. The extra three weeks spent verifying asset records, confirming parts numbers, and establishing accurate mileages was the foundation for everything that followed. Don't rush the setup phase.
Lesson 3
Make It Everyone's Job
CMMS isn't just a maintenance tool—it's an operations platform. Drivers, dispatchers, and managers all interact with the system. Training everyone, not just technicians, created the cultural shift necessary for sustained improvement.
Lesson 4
Celebrate Early Wins
When the first predicted failure was prevented—an alternator caught before it failed on a wedding charter—the whole team heard about it. Celebrating prevented disasters builds buy-in faster than any training session.
Lesson 5
Think Beyond Maintenance
The biggest financial impact came from revenue recovery, not cost reduction. Every bus returned to service was a bus generating $1,200-$1,800 daily. Frame the project as revenue optimization, not just maintenance improvement.
How Does This Apply to Different Fleet Sizes?
While this case study features a 38-bus fleet, the principles scale both up and down. Here's what comparable fleets typically experience.
| Fleet Size | Typical Improvement | Implementation Time | Expected ROI |
|---|---|---|---|
| 10-20 buses | 25-40% availability gain | 60-90 days | 250-350% (3-year) |
| 20-50 buses | 30-50% availability gain | 90-120 days | 350-500% (3-year) |
| 50-100 buses | 35-55% availability gain | 120-180 days | 400-600% (3-year) |
| 100+ buses | 40-60% availability gain | 180-270 days | 500-800% (3-year) |
Smaller fleets often see faster implementation but may have less room for improvement if they're already well-managed. Larger fleets take longer to implement but typically have more inefficiency to address and achieve higher absolute returns.
Ready to transform your charter fleet's reliability? Start with a free assessment of your current operations.
Getting Started Book a DemoWhat's Next for Southeast Regional Charter?
With operations stabilized at 99.7% availability, the company is now expanding. Two new MCI J4500 coaches joined the fleet in late 2024, with four more planned for 2025. The maintenance infrastructure that once couldn't keep 38 buses running now confidently supports fleet growth.
Current initiatives include integration with the booking system for automated maintenance window scheduling, electric bus pilot program with specialized maintenance protocols, and driver performance analytics tied to vehicle wear patterns.
Marcus Thompson's summary: "We went from hoping buses would start each morning to knowing exactly what condition every vehicle is in. That certainty changed everything—how we price contracts, how we schedule maintenance, how we sleep at night. The technology matters, but the real transformation was becoming a data-driven operation instead of a reactive one."
Frequently Asked Questions
What is considered good uptime for a charter bus fleet?
Industry-leading charter fleets target 95%+ fleet availability. World-class operations achieve 98-99% uptime through predictive maintenance and comprehensive CMMS implementation. The industry average hovers around 85-90%, meaning significant improvement potential exists for most operators.
How much revenue does a charter bus lose per day of downtime?
A single charter bus can generate $1,200-$1,800 in daily revenue during peak season, based on average daily rates of $1,000-$1,500 plus additional charges. Extended downtime costs compound with lost bookings, reputation damage, subcontractor expenses, and emergency repair premiums that can reach 3x normal rates.
How long does CMMS implementation take for a charter fleet?
Most charter fleets achieve basic implementation (asset records, PM schedules, digital inspections) in 60-90 days. Full optimization with predictive capabilities typically takes 12-18 months. This case study shows measurable improvements beginning at month 3, break-even at month 8, and full ROI by month 18.
What causes high downtime in charter bus operations?
Common causes include reactive maintenance culture (fixing only what breaks), poor parts inventory management leading to delays, inconsistent inspection protocols missing early warning signs, lack of maintenance history tracking causing repeat failures, and no preventive maintenance scheduling system allowing issues to compound.
Can small charter fleets benefit from CMMS?
Yes. Fleets as small as 10-15 buses see significant ROI from CMMS implementation. The key is choosing a system designed specifically for bus operations with appropriate pricing tiers for smaller operators. Even modest availability improvements—from 80% to 92%—generate substantial revenue recovery when multiplied across daily bookings.
Your fleet's transformation starts with a single step. Join hundreds of charter operators who've moved from reactive maintenance to predictive reliability.
Getting Started Book a Demo