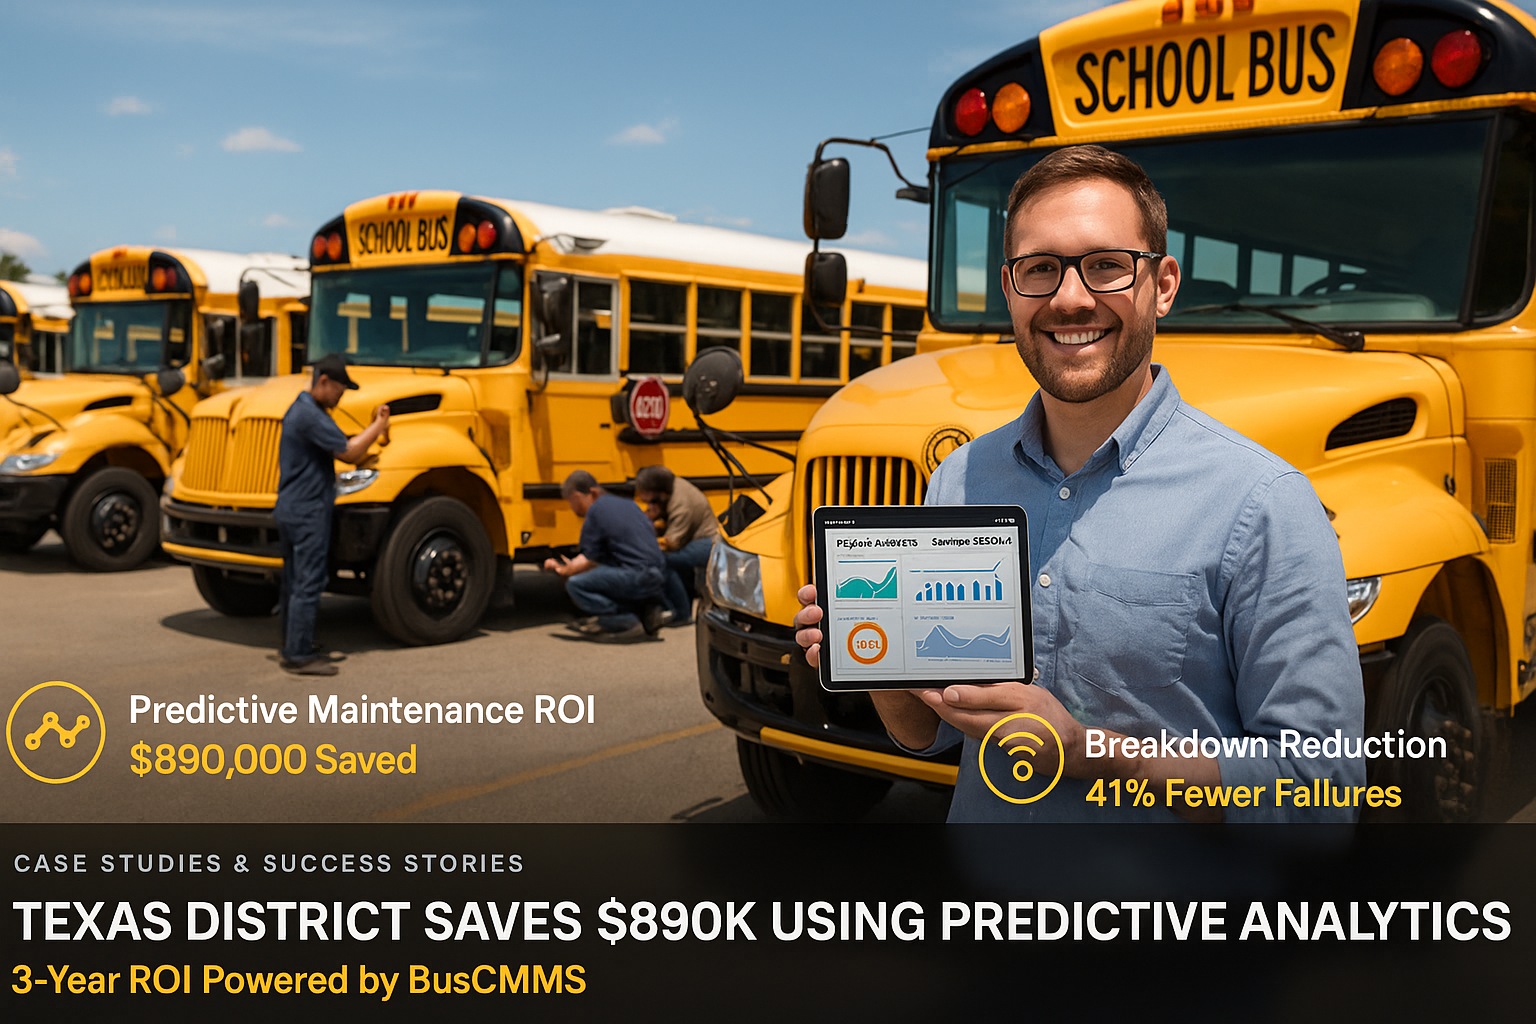
When a Central Texas school district's maintenance costs hit $2.1 million annually—with 23% going to emergency roadside repairs—the transportation director knew reactive maintenance wasn't working. Three years after implementing predictive analytics through BusCMMS, the district has saved $890,000, reduced roadside breakdowns by 73%, and extended average bus lifespan by 2.3 years. Here's exactly how they did it—and the data behind every decision.
What Problems Was the District Facing?
This Central Texas district serves 32,000 students across 47 campuses, operating a fleet of 445 buses that log 4.2 million miles annually. Before implementing predictive analytics, maintenance operations were trapped in a reactive cycle that drained budgets and disrupted student transportation.
High Emergency Repair Costs
23% of the annual maintenance budget ($483,000) went to emergency roadside repairs—tow trucks, mobile mechanics, and rush-ordered parts at premium prices.
$483K/year in emergency repairs
Frequent Roadside Breakdowns
The fleet averaged 18 roadside breakdowns per month during the school year, disrupting routes and requiring backup buses that weren't always available.
18 breakdowns/month average
Premature Bus Replacements
Buses were being retired at 12 years average instead of the industry standard 15 years. Catastrophic failures from missed maintenance issues accelerated replacement cycles.
3 years early replacement
Over-Maintenance Waste
Time-based maintenance schedules meant some buses got oil changes and inspections they didn't need, while others with harder routes were under-serviced.
$127K/year in unnecessary service
"We were changing oil on buses that didn't need it while engines failed on buses that did. Our maintenance schedule treated every bus the same—but no two buses are the same."
— District Transportation Director
What Is Predictive Analytics for School Buses?
Predictive analytics uses real-time sensor data, historical maintenance records, and AI algorithms to forecast when specific components will fail—before they actually break down. Instead of servicing buses on fixed schedules, districts service each bus based on its actual condition.
Scheduled vs. Predictive Maintenance
How Predictive Analytics Works
Data Collection
Telematics devices and OBD ports collect real-time data: engine temperature, oil pressure, battery voltage, brake wear, fuel consumption patterns, and 200+ other parameters.
Pattern Analysis
AI algorithms analyze data against historical failure patterns from thousands of similar buses, identifying anomalies that precede component failures by days or weeks.
Alert Generation
System generates prioritized alerts: "Bus 247 - Alternator showing pre-failure pattern. Recommend service within 5 days. Confidence: 87%."
Work Order Creation
CMMS automatically creates work orders, checks parts availability, and schedules service during optimal windows—minimizing route disruption.
Want to see how predictive analytics would work for your fleet? Get a personalized demo showing real failure predictions and potential savings based on your fleet size.
Getting Started Book a DemoHow Was the System Implemented?
The district implemented BusCMMS predictive analytics in phases over 5 months, starting with a pilot group of 50 buses before expanding to the full 445-bus fleet.
Pilot Program (50 Buses)
Installed telematics devices on 50 buses representing different ages, routes, and usage patterns. Established baseline data collection and validated sensor accuracy. Trained 4 lead technicians on alert interpretation.
Data Migration & Integration
Migrated 7 years of maintenance history into BusCMMS. Integrated with existing fuel management and routing software. Configured alert thresholds based on district's specific failure patterns.
Full Fleet Rollout
Expanded telematics to remaining 395 buses. Trained all 12 technicians and 3 shop supervisors. Launched mobile app for drivers to report issues directly into system. Activated automated work order generation.
Implementation By the Numbers
What Components Does the System Monitor?
The predictive analytics system monitors 12 major component categories, each with specific failure indicators and alert thresholds calibrated to this district's fleet.
Engine Health
Oil pressure, coolant temp, exhaust temp, fuel injection timing, compression
Predicted 23 engine failures before breakdown
Brake Systems
Pad thickness, rotor wear, air pressure, ABS sensor function
Eliminated all brake-related roadside stops
Transmission
Fluid temperature, shift patterns, torque converter slip, gear engagement
Caught 8 transmission issues early (saved $47K)
Electrical System
Battery voltage, alternator output, starter current draw, ground integrity
89% reduction in no-start incidents
HVAC System
Refrigerant pressure, compressor current, evaporator temp, blower performance
Zero AC failures during Texas summer routes
Fuel System
Injector balance, fuel pressure, filter restriction, consumption anomalies
12% improvement in fleet fuel efficiency
What Were the Detailed Results?
The district tracked results meticulously across three school years, documenting savings in five major categories. Here's the complete breakdown:
Roadside breakdowns dropped from 18/month to 5/month. Each avoided breakdown saves $1,200-$3,500 in tow fees, mobile mechanic charges, and rush parts.
Predictive alerts enabled planned parts ordering instead of emergency purchases. Reduced parts inventory by 31% while eliminating stockouts on critical components.
Technicians spent less time diagnosing problems (system pre-identified issues) and less overtime on emergency repairs. Wrench time increased from 62% to 78%.
Better maintenance extended average bus lifespan from 12 to 14.3 years. Deferred 4 bus replacements ($110K each) by 2+ years during the study period.
Ready to calculate potential savings for your district? Our team can build a custom ROI projection based on your fleet size, current costs, and maintenance challenges.
Getting Started Book a DemoWhat Was the ROI Timeline?
The district tracked cumulative costs and savings monthly. Here's how ROI developed over the 3-year period:
Hardware installation, software setup, training, and data migration. System learning fleet patterns.
Cumulative: -$127,000 (investment)
First predictive alerts preventing breakdowns. Emergency repairs begin declining. Parts ordering optimization kicks in.
Cumulative: -$42,000 (recovering investment)
Cumulative savings equal implementation costs. Every dollar saved from this point forward is net positive.
Cumulative: $0 (break-even)
System accuracy improves as it learns more patterns. Prediction confidence rises from 72% to 87%. Savings rate increases.
Cumulative: +$185,000
Mature system catching 85%+ of potential failures. Labor efficiency gains fully realized. Vehicle lifespan extension documented.
Cumulative: +$763,000 (net of all costs)
ROI Summary
What Can Other Districts Learn?
The transportation director shared five key lessons that determined the project's success:
1. Start with Your Worst Performers
The pilot focused on the 50 buses with the highest maintenance costs and most frequent breakdowns. This generated quick wins that built organizational support and provided the clearest ROI data for expanding the program.
2. Trust the Alerts (Eventually)
Initially, technicians doubted predictive alerts—"the bus seems fine." Within 3 months, after seeing predictions prove accurate, skepticism turned to reliance. The key was documenting every alert outcome to build confidence.
3. Historical Data Matters
Migrating 7 years of maintenance records gave the AI a foundation to identify patterns specific to this fleet. Districts starting with no historical data will see slower initial results but can still achieve strong ROI by year 2.
4. Integrate Everything
Connecting CMMS to routing software meant the system knew which buses ran hardest routes. This context improved prediction accuracy—a bus running hilly rural routes needs different maintenance than one on flat urban streets.
5. Measure Relentlessly
Monthly reporting on breakdowns, costs, and prediction accuracy kept the program accountable and helped identify areas for threshold adjustment. What gets measured gets improved.
Does This Work for Smaller Fleets?
Yes—but the economics scale differently. Here's how predictive analytics ROI typically breaks down by fleet size:
Expected Savings by Fleet Size
Smaller fleets see lower absolute savings but often higher percentage improvements because they typically have less sophisticated existing maintenance programs. A 30-bus rural district that eliminates just 2 roadside breakdowns per month can see 20%+ cost reduction.
Whether you run 30 buses or 500, predictive analytics can reduce costs and improve reliability. See what's possible for your specific fleet.
Getting Started Book a DemoKey Takeaways
This Texas district's $890K savings proves that predictive analytics delivers measurable ROI for school bus fleets. The 73% reduction in roadside breakdowns improved student safety and parent confidence while cutting costs. With an 8-month break-even and 601% three-year ROI, predictive maintenance isn't just better maintenance—it's a strategic investment that pays for itself many times over.
Frequently Asked Questions
How much can school districts save with predictive analytics?
School districts implementing predictive analytics CMMS typically save $1,500-$2,500 per bus annually. This Texas district with 445 buses saved $890K over 3 years—averaging $667 per bus per year, with savings accelerating as the system accumulated more data for pattern recognition.
What is predictive maintenance for school buses?
Predictive maintenance uses sensors, diagnostic data, and AI algorithms to forecast when bus components will fail—before they actually break down. Unlike scheduled maintenance (change oil every 5,000 miles), predictive maintenance analyzes real-time data to determine exactly when each specific bus needs service based on its actual condition and usage patterns.
How long does predictive analytics take to show ROI?
Most school districts see measurable ROI within 6-12 months. This Texas district broke even at month 8 and achieved full ROI by month 14. The first year typically shows 15-20% cost reduction, with savings increasing to 25-35% by year 2 as the system learns fleet patterns.
What components can predictive analytics monitor on school buses?
Predictive analytics can monitor engines (oil degradation, coolant temperature, fuel injection), brakes (pad wear, rotor condition, air pressure), transmissions (fluid condition, shift patterns), batteries (voltage, charge cycles), HVAC systems (refrigerant levels, compressor health), and tires (pressure, tread wear patterns).
Does predictive maintenance work for older school bus fleets?
Yes. While newer buses have more built-in sensors, aftermarket telematics devices can add predictive capabilities to buses of any age. This Texas district had buses ranging from 2-15 years old, and the predictive system worked across the entire mixed fleet by combining OBD data with external sensors.