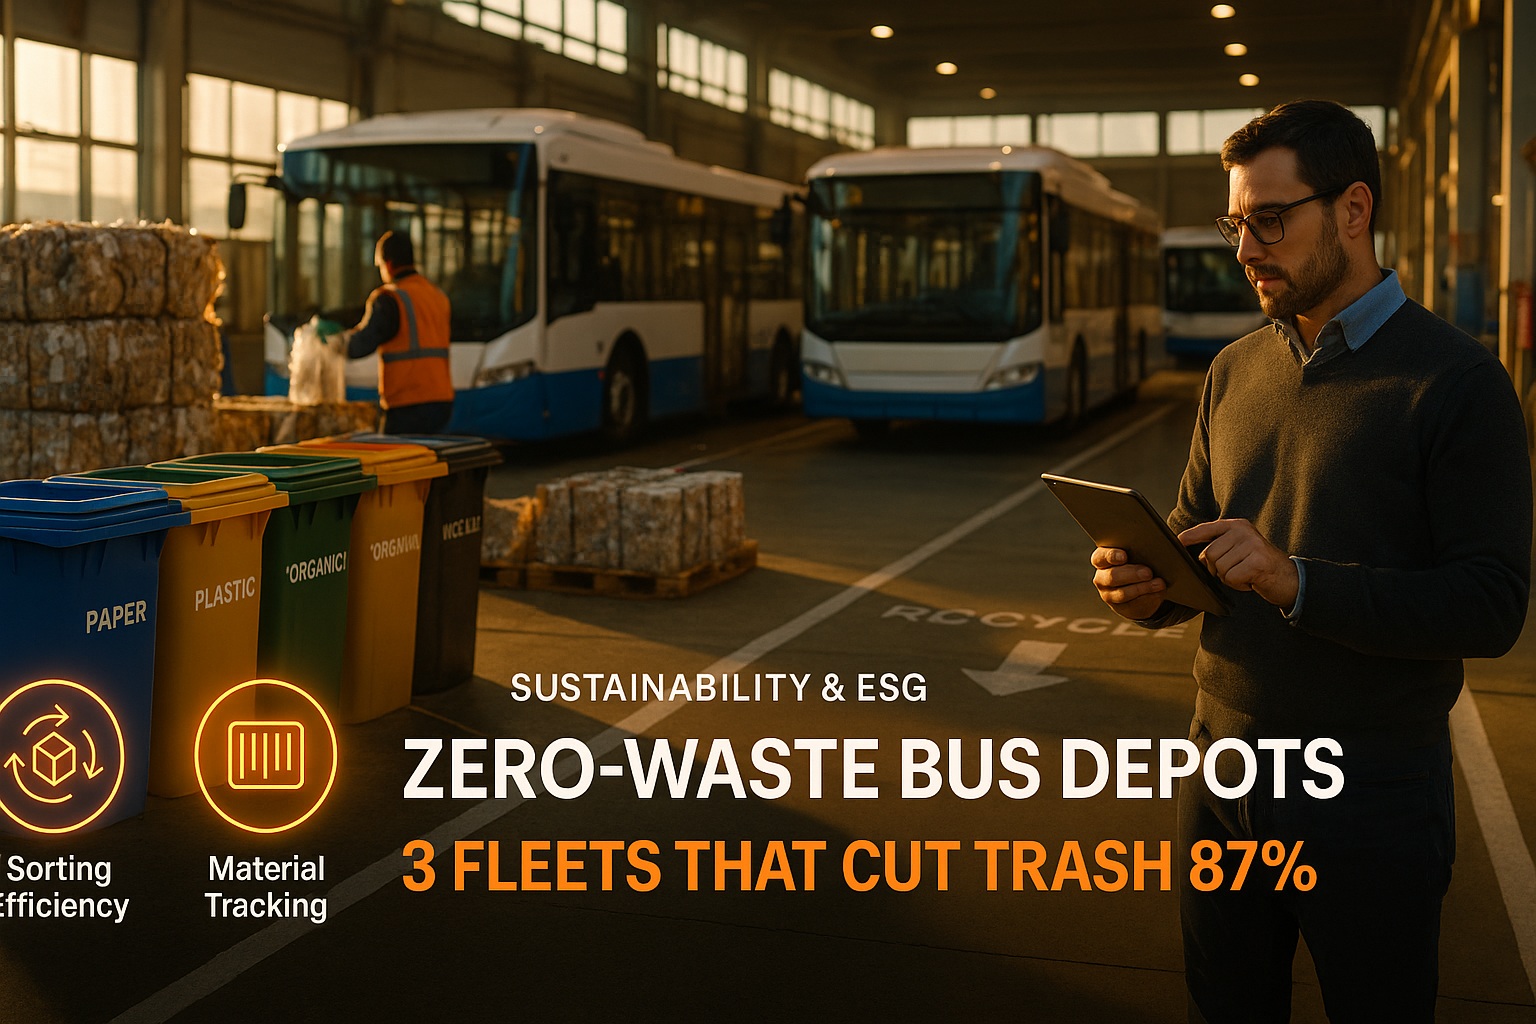
Every year, the average bus depot sends 47 tons of waste to landfills. Used oil, worn tires, brake dust, coolant containers, and parts packaging pile up faster than most fleet managers realize. But three transit agencies proved it doesn't have to be this way—cutting depot waste by 87% while actually reducing operating costs. Here's exactly how they did it.
Can Bus Depots Actually Achieve Zero Waste?
Yes. "Zero waste" in fleet operations means diverting 90%+ of depot waste from landfills through recycling, remanufacturing, and material recovery. The 3 fleets profiled here achieved 87-94% diversion rates within 90 days, turning waste streams into revenue streams while meeting ESG reporting requirements.
The Hidden Waste Problem in Bus Depots
Most fleet managers underestimate how much waste their depots generate. A 50-bus fleet produces an average of 47 tons of waste annually—and 78% of that waste is actually recyclable or recoverable. The problem isn't the waste itself; it's the lack of systems to capture and divert it.
What 50 Buses Generate Annually (Average Depot)
When depots lack proper waste tracking, recoverable materials end up in dumpsters—costing money twice. First, you pay disposal fees. Second, you lose the rebate value of recyclable materials. CMMS platforms with material tracking solve this by logging every disposal and routing materials to the right recovery channels.
Case Study #1: Metro Transit Authority (142 Buses)
Metro Transit's two depots were sending 134 tons of waste to landfills annually—including 4,800 gallons of used oil that should have been recovered. Their maintenance supervisor discovered the problem during an ESG audit: waste was being combined into single dumpsters, contaminating recyclable streams and eliminating recovery options.
What They Changed
Want to see how CMMS disposal tracking works? Book a quick demo to see automated waste stream reporting in action.
Case Study #2: Regional School District Fleet (78 Buses)
This school district faced a common challenge: a small maintenance team (4 technicians) with no time for "extra" sustainability programs. The fleet manager needed a zero-waste approach that didn't add workload. The solution was embedding waste diversion into existing maintenance workflows through CMMS automation.
What They Changed
Case Study #3: Charter Bus Company (54 Coaches)
This charter operator had a competitive advantage motivation: corporate clients were increasingly requiring sustainability documentation for contract bids. Without verifiable waste diversion data, they were losing RFPs to competitors. Zero-waste became a business development investment, not just an environmental initiative.
What They Changed
Ready to track every waste stream in your depot? Start your free trial and set up disposal codes in minutes.
The 6 Waste Streams Every Depot Must Manage
Zero-waste depot operations require systematic management of six primary waste categories. Each has different handling requirements, recovery options, and revenue potential.
Includes: Motor oil, transmission fluid, hydraulic fluid, brake fluid
Recovery Rate: 100% recyclable
Value: $0.50-$1.20/gallon rebate from certified recyclers
Key: Never mix fluid types—contamination eliminates rebate value
Includes: Worn tires, damaged casings, tire tubes
Recovery Rate: 95% recyclable (retreading, crumb rubber, TDF)
Value: Retreading saves $180/tire; disposal costs $3-8/tire
Key: Evaluate every casing for retread potential before disposal
Includes: Engine coolant, A/C refrigerant (R-134a, R-1234yf)
Recovery Rate: 100% recyclable with proper separation
Value: Free pickup common; some recyclers pay $0.25-$0.50/gallon
Key: Closed-loop recycling systems eliminate disposal entirely
Includes: Lead-acid, lithium-ion (EV/hybrid), AGM batteries
Recovery Rate: 99% for lead-acid; 95%+ for lithium with proper handling
Value: Lead-acid: $8-15 core credit; Lithium: varies by size/condition
Key: Lithium batteries require special storage and certified handlers
Includes: Brake rotors, drums, calipers, exhaust components, engine parts
Recovery Rate: 80% remanufacturable; 100% scrap recyclable
Value: Core returns: 30-50% of new part cost; Scrap: market rate
Key: Always check remanufacturing eligibility before scrapping
Includes: Oil filters, fuel filters, air filters, shop rags, floor absorbents
Recovery Rate: 85% with proper processing
Value: Oil filters: metal recycling after draining; Absorbents: varies
Key: Hot-drain oil filters for 12+ hours before disposal
90-Day Zero-Waste Implementation Timeline
All three case study fleets achieved 85%+ waste diversion within 90 days using this phased approach. The key is starting with high-value, easy-win waste streams before tackling more complex materials.
Need help planning your 90-day rollout? Schedule a demo and we'll walk through implementation for your fleet size.
How CMMS Tracks Waste Streams Automatically
Manual waste tracking fails because it adds work. Integrated CMMS platforms embed waste tracking into existing workflows—when a technician closes a work order, they simply select a disposal code for removed parts. The system handles the rest.
Every part removal includes mandatory disposal destination: Recycled, Remanufactured Core, Scrap Metal, Hazmat, or Landfill. No extra steps—just a dropdown selection.
System knows standard weights for common parts. When you dispose of 4 oil filters, it automatically logs 8 lbs to the "Oil Filter Recycling" stream.
Real-time visualization of waste by category, disposal method, and diversion percentage. Spot problems before they become audit findings.
Connect recycler pickup schedules to inventory levels. System alerts when oil tank reaches pickup threshold or tire storage approaches capacity.
One-click export of waste diversion data formatted for GRI, SASB, or custom ESG reporting frameworks. No manual data compilation.
Log rebates and core credits against waste streams. See exactly how much your recycling program generates vs. disposal costs.
Sample CMMS Waste Tracking Dashboard
Calculate Your Depot's Zero-Waste Savings
Waste Reduction ROI Calculator
Implementation costs (bins, signage, training): ~$3,500 one-time
Payback period: 16 days
Savings by Fleet Size (87% Diversion Rate)
Want to calculate savings specific to your fleet? Get started free and run the numbers with your actual waste volumes.
Frequently Asked Questions: Zero-Waste Bus Depots
How do you define "zero waste" for bus depot operations?
Zero waste in fleet operations typically means achieving 90%+ diversion of depot waste from landfills through recycling, remanufacturing, composting, or energy recovery. The TRUE (Total Resource Use and Efficiency) certification standard, used by the charter company in Case Study #3, requires 90% diversion for Bronze certification, 95% for Silver, and 99% for Platinum. Most depots can realistically achieve 85-92% diversion within 90 days of implementing systematic waste tracking.
What's the biggest waste reduction opportunity most depots miss?
Used oil recovery. The average 50-bus fleet generates 2,400 gallons of used oil annually worth $1,200-$2,880 in recycler rebates—but many depots mix oil with other fluids, contaminating it and eliminating rebate eligibility. Simply keeping oil streams separate and contracting with a certified recycler captures immediate value with zero behavior change required from technicians.
How do we track waste without adding workload for technicians?
Modern CMMS platforms embed disposal tracking into existing work order workflows. When closing a work order, the technician selects a disposal code from a dropdown—Recycled, Remanufactured, Scrap, Hazmat, or Landfill. This adds 3-5 seconds per work order while generating complete waste tracking data. Color-coded bins matching the CMMS codes eliminate sorting decisions at the point of disposal.
What certifications exist for zero-waste fleet operations?
TRUE (Total Resource Use and Efficiency) certification is the most recognized standard for zero-waste facilities, including fleet depots. Administered by GBCI (the same organization behind LEED), TRUE certification provides third-party verification of waste diversion rates. Other relevant certifications include ISO 14001 (environmental management systems) and EPA WasteWise recognition. These certifications are increasingly required or preferred in government and corporate fleet contracts.
How do lithium-ion batteries from electric buses affect zero-waste programs?
Lithium-ion batteries require specialized handling but are highly recyclable (95%+ material recovery). Unlike lead-acid batteries which can go to any battery recycler, lithium batteries must be processed by certified facilities with proper thermal management and cell-level dismantling capabilities. The good news: as EV adoption grows, lithium recycling infrastructure is expanding rapidly, and some recyclers now pay for large-format bus batteries due to their valuable cobalt and nickel content.
Can small fleets (under 25 buses) achieve meaningful waste reduction?
Absolutely. Smaller fleets often achieve higher diversion rates because waste streams are easier to manage with a single point of accountability. The key for small fleets is joining regional recycling consortiums (especially for tires) and negotiating pickup-on-call schedules with recyclers rather than fixed routes. A 25-bus fleet can typically achieve 85%+ diversion while generating $15,000-$20,000 in annual savings through recycling rebates and avoided disposal costs.