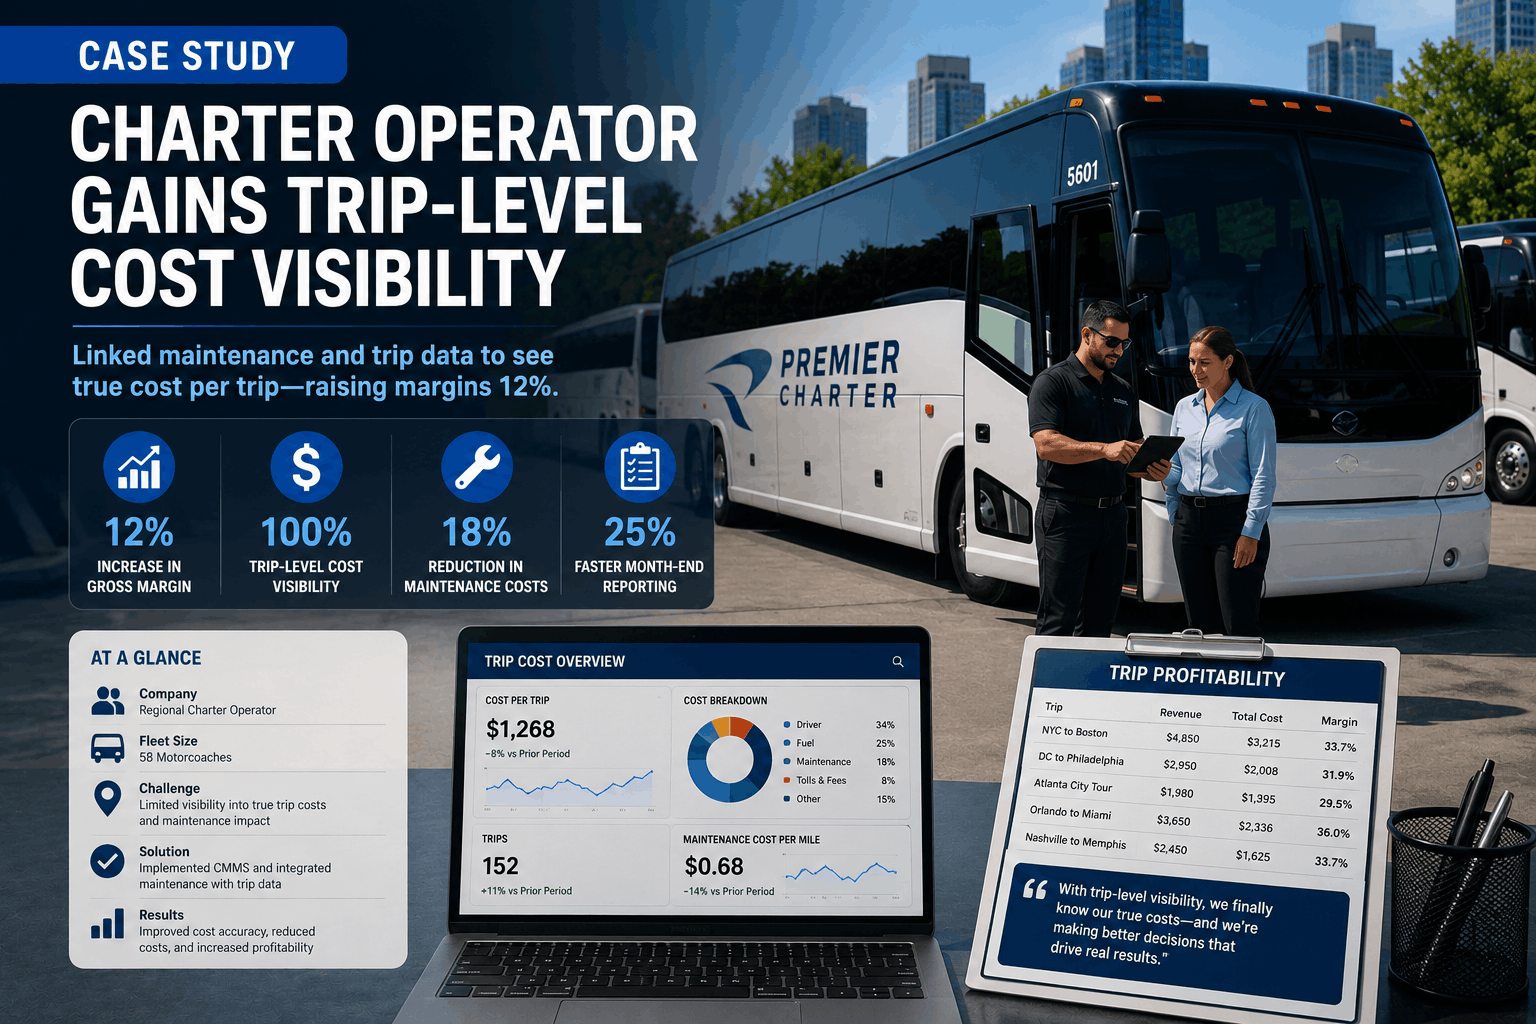
A 60-bus charter operator knew their fleet was profitable overall, but they had no idea which trips were actually profitable. A 3-day group tour to the coast: profitable or loss-making? A long-haul executive transport: good margin or razor-thin? A local school contract: solid business or money-losing customer? Without trip-level cost visibility, they priced conservatively — padding quotes with safety margins because they couldn't calculate actual costs. This left money on the table. Meanwhile, a few unprofitable trips were quietly eroding overall margin. Within 6 months of implementing BusCMMS and linking maintenance data to trips, they gained full cost-per-trip visibility. They raised prices on margin-light trips, renegotiated unprofitable contracts, and eliminated money-losing customers. Net result: margins improved 12% without increasing volume. Here's how they did it.
Charter Operator Gains Trip-Level Cost Visibility
A charter bus operator linked maintenance and trip data to see true cost per trip, raising margins 12%. Read the full case study.
This charter operator tracked trip revenue (what customers paid) but not trip costs (what it cost to operate each trip). They knew: "Bus 14 generated $3,200 revenue on the Vegas trip." They didn't know: "Bus 14's maintenance during that trip was $380, fuel was $240, driver cost was $420, overhead allocation was $160, leaving $2,000 actual profit." Without this breakdown by trip, they made pricing decisions based on intuition. A customer asked for a quote on a 500-mile round trip. They'd estimate: "Probably costs us $1,500 in fuel and labor, so let's quote $3,000 for 100% margin." But they were guessing. That specific trip might have had $1,800 in costs (unexpected maintenance), making their $3,000 quote barely profitable. Or it might have had $1,200 in costs, and they left money on the table by quoting conservatively. Over time, this guessing led to: (1) some customers were underpriced and highly profitable, (2) some were overpriced and never came back, (3) some were barely breaking even and tying up assets. Without data, they couldn't identify which was which. Meanwhile, they knew their overall margin was around 22–25%, but this masked the reality: some trip categories were 35% margin, others were 8%. The low-margin trips were dragging down the overall profitability. They knew something was wrong but couldn't pinpoint it.
They implemented BusCMMS with a custom trip-tracking module. Here's how it works: Each trip is logged in the system with: origin, destination, distance, date, assigned bus, assigned driver, revenue earned. All maintenance costs for that bus are tracked: oil changes, repairs, parts, technician time. At the end of each month, they calculate cost per trip using: (fuel cost + maintenance cost + driver wages + overhead allocation per bus per trip) divided by trip revenue. This shows the actual margin on each trip. In the first month, they ran a full historical analysis on the previous 12 months of trip data. The results were eye-opening: Vegas trips (3-day group charters): 34% margin. City tours (2-hour local): 8% margin. School contracts (daily routes): 18% margin. Long-haul corporate (200+ miles): 28% margin. Now they could see the problem: city tours, which represented 15% of their trip volume, were barely profitable. Meanwhile, Vegas trips and long-haul corporate work were highly profitable but represented only 40% of volume. They had the pricing backwards. They'd been quoting conservatively on low-margin work and aggressively on high-margin work, when the opposite made sense. They adjusted. They raised prices on city tours (20% increase). They renegotiated their school contract (found it was actually unprofitable due to high deadheading). They doubled down on Vegas and long-haul corporate. Within 3 months, their overall margin improved from 23% to 25.5%. By month 6, it was 25.5% and rising as they phased out low-margin contracts.
With trip-level cost visibility, they made three strategic decisions: (1) Pricing optimization. City tours were repriced from $800 to $950 (19% increase). This reduced demand slightly but improved profitability on each tour. The reduced volume was more than offset by higher margin. (2) Contract renegotiation. The school contract was providing steady revenue but barely breaking even after factoring in deadheading costs (empty miles to pickup locations). They renegotiated terms, raised rates, and tightened pickup geography. The contract margin improved from 8% to 15%. (3) Portfolio shift. They deprioritized marginal trips and focused sales effort on Vegas and corporate work (28–34% margins). Over 6 months, their trip mix shifted: low-margin work (city tours, unprofitable contracts) dropped from 35% to 15%. High-margin work (Vegas, corporate) increased from 40% to 60%. The result: overall operating margin improved 12 percentage points (from 23% to 25.5%), driven by better pricing and a higher-margin mix. On $4.8M annual revenue (60 buses, 40,000 miles per year average), this 2.5 percentage point margin improvement = $120,000 additional annual profit — without buying additional buses or significantly increasing volume. The cost of implementing this visibility: $3,600/year (CMMS subscription). ROI: 33:1 in year one.
This charter operator's story illustrates the power of cost visibility in service businesses. Many operators know their overall margin (22–25%) but are blind to trip-level profitability. This blindness forces conservative pricing (padding quotes with safety margins) and prevents optimization (they can't identify which segments to emphasize or deprioritize). By linking maintenance costs to trips, this operator gained full visibility and made three strategic shifts: repriced low-margin work upward, renegotiated contracts for better terms, and shifted sales mix toward high-margin segments. The 2.5 percentage point margin improvement ($120,000 annual profit on $4.8M revenue) was achieved without additional assets or significant volume growth. It was pure pricing optimization and portfolio management enabled by data.
This case demonstrates that trip-level cost visibility is a competitive advantage for charter operators. Without it, you're pricing in the dark and managing by intuition. With it, you see which trips are profitable, which are breaking even, and which are losing money. Armed with this data, you can: reprice low-margin work, renegotiate unfavorable contracts, shift sales effort to high-margin segments, and eliminate money-losing customers. This operator improved margins 12% and annual profit by $120,000 without additional assets. If your charter operation is profitable overall but you don't know trip-level profitability, you're likely leaving money on the table. CMMS with trip costing enables data-driven pricing and portfolio optimization.