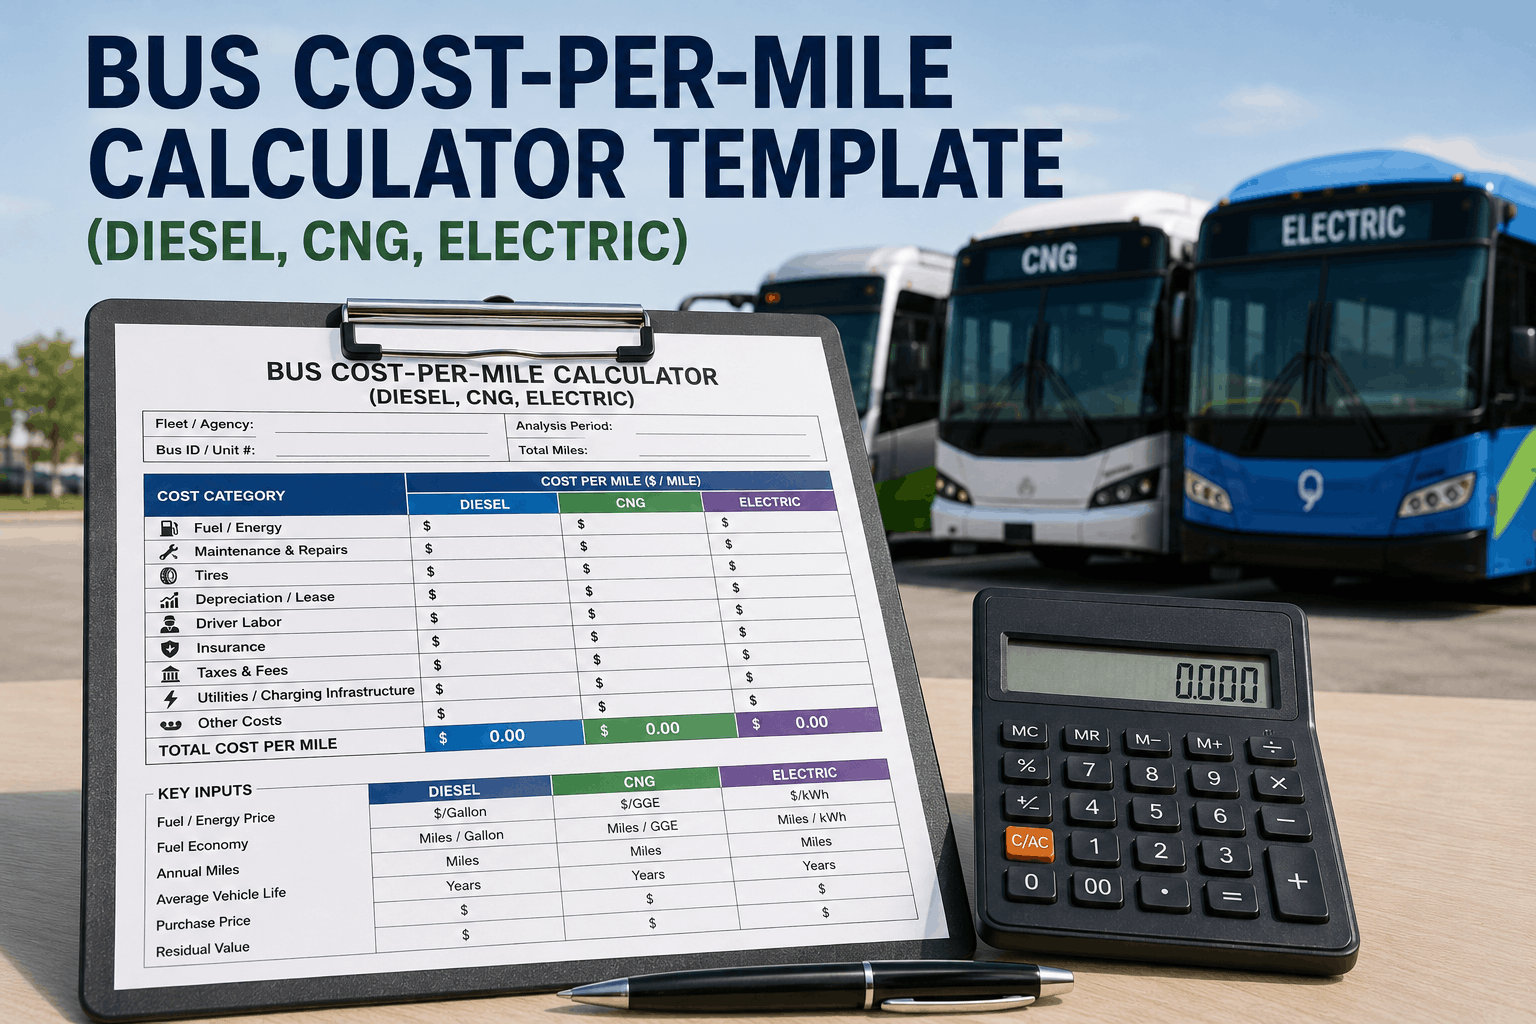
A municipal transit agency operating 92 diesel buses, 18 CNG buses, and 6 battery-electric buses needed a clear picture of their true operating costs per mile to inform their fleet replacement strategy. They tracked fuel expenses from fuel cards, maintenance costs from disparate garage records, and labor from payroll systems, but had no unified method to calculate total cost per mile across different fuel types. Depreciation, insurance, and overhead were either estimated or completely omitted from their internal comparisons. When the agency applied for federal low‑no emission grant funding, they struggled to produce credible cost projections for electric buses because they lacked a standardized calculator that captured all cost components. After implementing a comprehensive cost‑per‑mile template that accounts for fuel, maintenance, tires, labor, depreciation, insurance, and overhead, the agency discovered that their CNG buses had a 12% lower CPM than diesel, while electric buses showed a 38% lower CPM on fuel but higher depreciation. Armed with accurate data, they successfully secured a $2.4 million grant for electric bus procurement. A true cost‑per‑mile model turns fleet financial data into a strategic decision‑making tool.
Bus Cost‑Per‑Mile Calculator Template: Diesel, CNG, Electric
Compare fuel types with accurate cost‑per‑mile data. Capture fuel, maintenance, depreciation, labor, and overhead in one unified template.
Cost‑Per‑Mile Impact — 116‑Bus Fleet
Diesel CPM (Current)
$1.42 – 1.68 per mile
CNG CPM (Current)
$1.25 – 1.45 per mile
Electric CPM (Current)
$0.98 – 1.22 per mile
Template Implementation
Accurate CPM for all fuel types
Total Cost Visibility
100% cost components captured
Grant Success Rate
$2.4M secured with data
A structured CPM calculator turns fleet expense data into a strategic roadmap for procurement and operations.
The Cost‑Per‑Mile Challenge: Fragmented Data vs. True TCO
Many transit operators calculate cost‑per‑mile using only fuel and basic maintenance, leaving out depreciation, labor overhead, insurance, and administrative costs. This partial view leads to inaccurate comparisons between diesel, CNG, and electric powertrains. A comprehensive CPM template must capture all six major cost categories: Fuel/Energy (diesel, CNG, electricity), Maintenance and Tires (parts, labor, tire replacement), Driver and Staff Labor (wages, benefits, training), Depreciation (capital cost spread over useful life), Insurance and Licensing (premiums, registration), and Overhead and Facilities (garage, utilities, administration). By collecting these inputs in a structured format, fleet managers can generate accurate per‑mile costs, identify cost drivers, and model the impact of replacing vehicles with alternative fuels.
Partial Cost View (Inaccurate)
Fuel Included
Yes – but only pump price, not taxes or delivery
Maintenance Included
Basic parts and oil, but not labor or tire wear
Depreciation Included
Often estimated or omitted
Overhead Included
Rarely captured
Total Cost CPM Template
Fuel Included
Full fuel cost with taxes, delivery fees, and energy rates
Maintenance Included
Parts, labor, tires, and scheduled service fully tracked
Depreciation Included
Straight‑line or usage‑based depreciation with residual
Overhead Included
Allocated garage, admin, and facility costs
Critical CPM Metrics to Track by Fuel Type
An effective CPM calculator organizes data around four key input categories. First: Fuel and Energy Costs—track price per gallon (diesel/CNG) or kilowatt‑hour (electric), including taxes, delivery, and charging infrastructure. Second: Maintenance and Repair—record parts, labor, tires, and outside repairs per vehicle, segregated by fuel type to capture differences (e.g., electric buses have lower brake and oil change costs). Third: Depreciation and Financing—capture purchase price, grant funding, residual value, and financing costs, allocated over expected life. Fourth: Operations and Overhead—driver wages, benefits, training, insurance, and facility costs allocated per mile. With these inputs, the template automatically calculates CPM for each powertrain, enabling side‑by‑side comparisons and scenario analyses for fleet planning.
CPM Comparison Benchmarks (Example Data)
Diesel Bus (12‑year life)
CNG Bus (12‑year life)
Electric Bus (12‑year life)
Maintenance Savings (EV vs Diesel)
Accurate CPM data reveals which fuel type delivers the lowest total cost over the vehicle’s useful life.
CPM Framework in Action: Real‑World Fleet Decision Support
A state DOT operating 340 buses across urban and rural routes needed to justify a pilot program for 20 electric buses. They had historical fuel and maintenance data but lacked a standardized method to project total cost per mile for electric vs. diesel. Using a comprehensive CPM template, they input actual diesel costs from the previous year and projected electric costs using utility rates, maintenance estimates from manufacturers, and depreciation assumptions. The template revealed that electric buses had a 22% lower fuel cost per mile but a 40% higher depreciation cost, resulting in a net 8% total CPM advantage for electric. This data was instrumental in securing state funding and gaining board approval. After the pilot, actual CPM data aligned within 3% of projections, validating the template’s accuracy and building confidence for future fleet electrification decisions.
Incomplete CPM Approach
Only fuel and oil changes tracked; no depreciation or overhead.
Electric and CNG costs estimated without data.
Grant applications lacked credible cost projections.
Result: Failed grant applications and uncertain fleet planning.
Unified CPM Template
All cost components (fuel, maintenance, labor, depreciation, overhead) captured per vehicle.
Accurate comparisons across diesel, CNG, electric.
Data‑driven grant applications and procurement decisions.
Result: $2.4M grant secured and successful EV pilot.
Strategic Rollout: 90‑Day CPM Template Integration
Implementing a comprehensive CPM calculator can be accomplished in three phases. Month one: Data Collection and Validation—gather fuel receipts, maintenance records, payroll data, insurance premiums, and depreciation schedules. Normalize data to a common time period (e.g., annual). Month two: Template Configuration and Calculation—input data into the structured template, verify formulas, and generate initial CPM results. Compare with industry benchmarks. Month three: Automation and Reporting—integrate with your fleet management system to auto‑pull fuel and maintenance data, enabling real‑time CPM updates. Train finance and operations teams to interpret results and use them for budget forecasting and lifecycle planning.
CPM Template Rollout Timeline
Days 1–30
Days 31–60
Days 61–90
Strategic Planning
The Bottom Line
Calculating bus cost‑per‑mile with incomplete data leads to poor procurement decisions, inaccurate grant applications, and missed opportunities for operational savings. A comprehensive CPM template that captures fuel, maintenance, depreciation, labor, and overhead across all powertrains provides the clarity needed for strategic fleet management. With accurate data, you can confidently compare diesel, CNG, and electric options, justify investments to stakeholders, and track actual costs against projections. BusCMMS provides the tools to build and maintain a dynamic CPM calculator, integrate with your existing financial and maintenance systems, and generate real‑time cost insights that drive smarter decisions.
Accurately Compare Diesel, CNG, and Electric Costs.
Capture all cost components, generate side‑by‑side CPM reports, and justify fleet investments. Free 14‑day trial.
Frequently Asked Questions
What cost components should be included in a bus CPM calculation?
A complete CPM includes fuel/energy, maintenance (parts, labor, tires), depreciation (capital cost minus residual), driver and staff labor, insurance and licensing, and allocated overhead (garage, administration).
How do I account for depreciation in CPM?
Depreciation is typically calculated as (purchase price minus expected residual value) divided by total expected lifetime miles. The template can handle straight‑line or usage‑based depreciation methods.
Can the template compare multiple fuel types side‑by‑side?
Yes. The template allows you to input separate cost data for diesel, CNG, electric, and other fuels, and automatically generates a comparative CPM summary for each vehicle class.
How do I handle grant or subsidy impacts on electric bus costs?
You can deduct grant amounts from the purchase price before calculating depreciation, or treat them as separate income. The template includes fields to adjust capital costs for incentives.
How often should CPM be recalculated?
Best practice is to update CPM quarterly to capture fuel price fluctuations, maintenance trends, and changes in labor or insurance costs. Some fleets update monthly for real‑time insight.
Can the template be used for grant reporting and compliance?
Absolutely. The structured output provides auditable cost data that can be used for FTA grant reporting, cost‑effectiveness studies, and fleet replacement justifications.
Bring Your Fleet Cost Analysis Into a Data‑Driven, Transparent Framework.
Standardize CPM calculations, compare powertrains, and optimize your fleet budget. Free 14‑day trial.