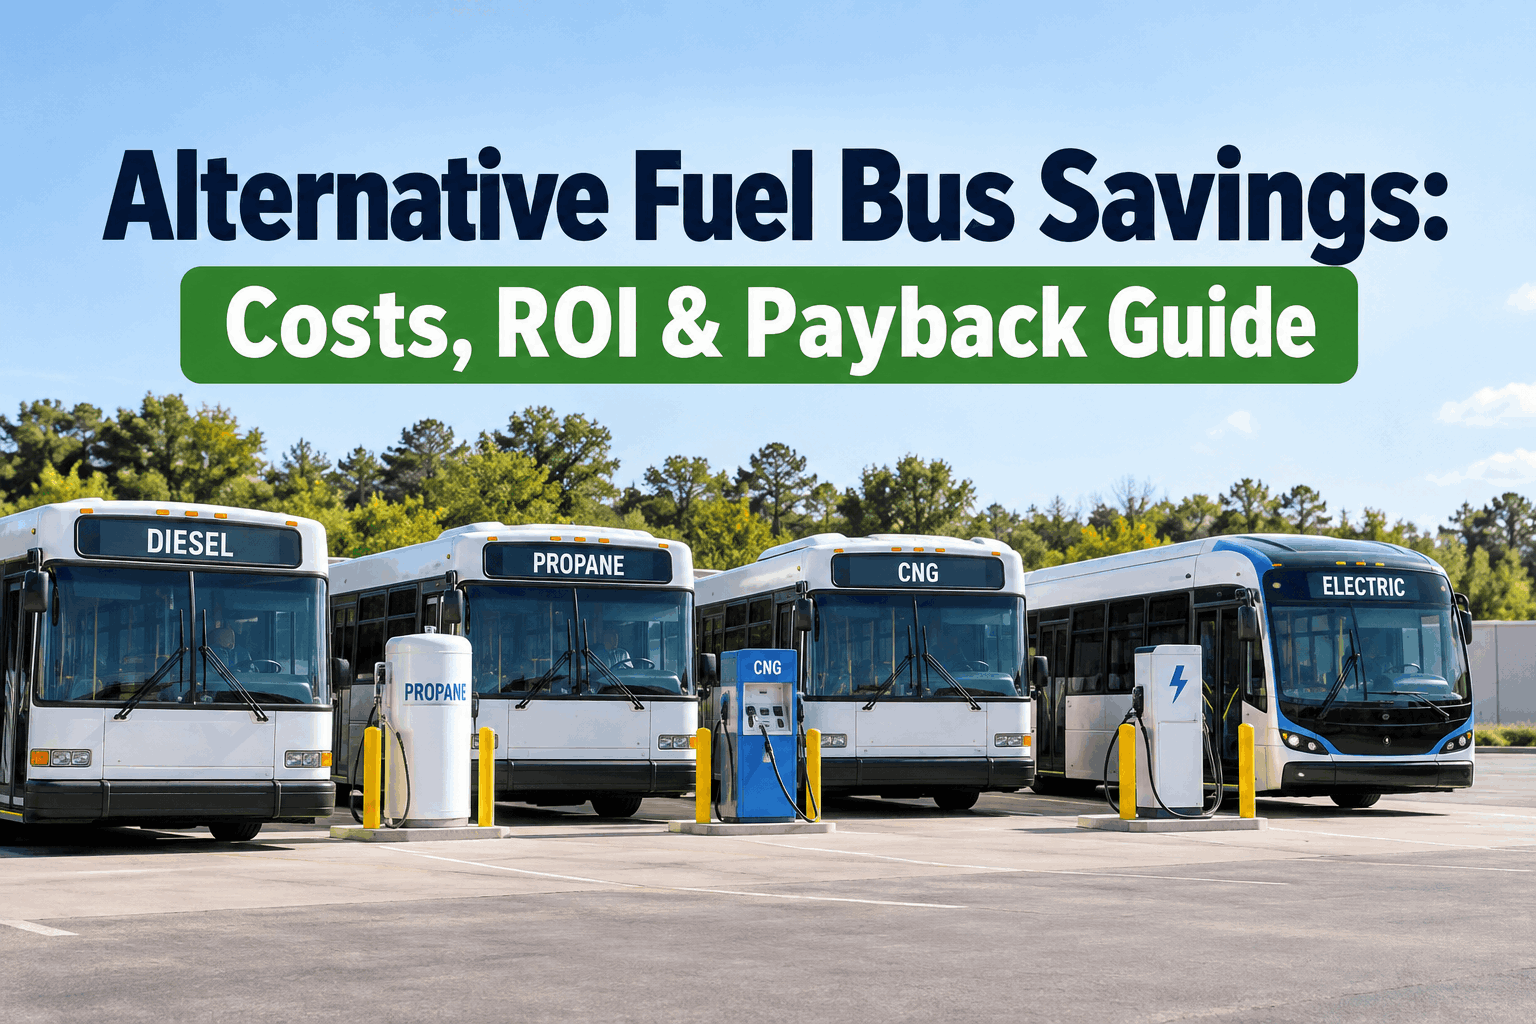
The pitch is always the same: this fuel saves you forty cents a mile. What the slide never shows is the acquisition premium you paid to get those savings, the fueling or charging infrastructure you had to build, and the maintenance that shifted rather than vanished. Alternative fuel bus savings are real — but gross fuel savings are not the same as money in your budget. The number that matters is net savings after everything, and the payback period that follows from it. You can see your real per-mile costs by fuel in a demo and run that math on your own fleet.
Alternative Fuel Bus Savings: Net Numbers, ROI, and Real Payback
Propane, CNG, and electric can all cut your per-mile fuel cost. Whether they cut your total cost — and how long before they pay back — is a different calculation. Here is how to run it on real data.
Why Gross Fuel Savings Isn't Your Savings
A cheaper fuel per mile is where the savings story starts, not where it ends. Three costs stand between the headline number and anything that reaches your budget — and a vendor comparison rarely subtracts all three.
The acquisition premium
Alternative fuel buses usually cost more upfront than diesel. That premium has to be spread across the bus's life and clawed back from fuel savings before a single dollar is truly saved.
The infrastructure bill
Chargers, a CNG station, or a propane tank are capital costs with their own lifespan. Spread across your fleet, they can quietly eat a large share of the per-mile saving.
Maintenance shifts, not vanishes
Electric cuts some routine work but adds battery and high-voltage considerations; CNG and propane change fuel-system service. Count the new costs, not just the removed ones.
Net savings = gross fuel savings minus the amortized premium, infrastructure, and maintenance change. Only the net number belongs in a business case.
The Payback Equation Every Fuel Decision Needs
Once you have the net annual saving, payback is simple arithmetic — and it is the single number a finance director will actually ask for. Everything else in the pitch is supporting detail.
If the payback lands inside the bus's service life with margin to spare, the switch pays. If it lands near or past end of life, the savings never fully arrive.
Grants and incentives shrink the top of that fraction, which is why they can swing a decision — but the saving underneath still has to be real on your routes.
The hard part is not the division — it is getting an honest net annual saving to divide by, which only your own operating data provides. You can sign up free and build that number from your real costs.
Where Each Alternative Fuel Actually Saves
Each fuel saves in a different place and gives some of it back somewhere else. Knowing where the saving comes from — and where it leaks — tells you whether your operation can capture it, which you can see on your own fleet in a demo.
Saves: cheaper fuel than diesel, low acquisition premium, simple onsite tank
Gives back: lower energy density, so more fuel volume per mile
Usually the shortest payback because the upfront premium is small.Saves: low, stable fuel cost that resists diesel price spikes
Gives back: heavy station investment, fuel-storage weight that trims range
Payback depends on volume — high annual miles amortize the station.Saves: lowest fuel and routine-maintenance cost per mile
Gives back: highest premium, charging capital, battery and winter-range factors
Largest per-mile saving, but grants often decide whether payback fits the life.For the full dollar-by-dollar breakdown, our team runs the numbers in the diesel vs electric vs propane total cost comparison. This page is about the savings math on top of it.
What Decides Whether Alternative Fuel Savings Are Real
Two fleets can buy the same propane or electric buses and get opposite results. These are the factors that decide whether the savings show up in your budget — check each one against your own operation.
- Annual mileage per busSavings are per mile, so the more a bus runs, the faster the premium and infrastructure pay back. Low-mileage buses may never reach payback.BIGGEST LEVER
- How the infrastructure is spreadA station or charger shared across many buses amortizes fast; the same cost on a handful of buses can erase the saving entirely.SCALE
- Grants and incentives securedRebates cut the upfront cost directly, shortening payback. But build the case so it survives if a grant does not come through.ACCELERATOR
- Real maintenance deltaThe maintenance saving is only the removed work minus the new work. Measure both on your own buses rather than trusting a generic figure.VERIFY
- Service life vs payback periodIf payback lands well inside the bus's useful life, the savings are real; if it lands near end of life, they are mostly theoretical.THE TEST
Every one of these is measurable on your own fleet — annual miles, infrastructure spread, and the true maintenance delta all come straight from your records. You can sign up free and pull the numbers your payback case needs.
How BusCMMS Proves Alternative Fuel Savings
A savings claim is a forecast until the buses run. BusCMMS supplies the real numbers both halves of the decision need — the baseline to build the payback case before you buy, and the ongoing proof that the saving actually landed after you did.
Real cost per mile by fuel
The net-savings baseline, calculated from your own work orders and fuel entries — the honest input the payback math needs.
Maintenance delta, measured
Track what alternative-fuel buses actually cost to maintain versus diesel, so the maintenance half of the saving is real, not assumed.
Before-and-after proof
Compare projected savings to what the fleet actually delivered, so you can confirm the payback — or flag a miss early.
That closes the loop a brochure never can: you forecast the saving on your data, then prove it with the same system. To run it on your fleet, book a demo and bring your cost numbers.
A Finance Director's Take
Key Takeaways on Alternative Fuel Bus Savings
Alternative fuel bus savings are a net number and a payback period, not a per-mile headline. Four things to carry into the business case.
Net, not gross
Subtract premium, infrastructure, and maintenance change first.
Payback is the real question
Extra upfront over net annual saving — must beat service life.
Mileage and scale decide it
High miles and shared infrastructure make savings real.
Prove it after you buy
Confirm the saving landed; do not assume the forecast held.
Run alternative fuel bus savings as a net-savings and payback calculation on your own operating data, and the switch becomes a decision you can defend to finance rather than a hope pinned to a vendor slide. The fuels can absolutely pay — the proof is in your numbers, not the brochure's.