The bus fuel type decision is no longer about upfront cost—it's about total cost of ownership over 12-15 years of operation. In 2026, diesel school buses cost $110,000-$130,000 while electric buses cost $300,000-$400,000. But federal incentives cover $170,000-$325,000 of electric bus cost, and electric buses save $4,000-$11,000 annually in fuel and maintenance. Over a complete bus lifecycle, electric buses often have lower total cost of ownership than diesel equivalents. This comprehensive analysis breaks down purchase price, fuel costs, maintenance expenses, infrastructure requirements, and federal incentives to help you make data-driven procurement decisions that optimize fleet economics for the next 12-15 years.
Diesel vs Electric vs Propane Bus: Complete Cost Comparison 2026
Side-by-side total cost comparison for diesel, electric, and propane school and transit buses. Includes purchase price, federal incentives, fuel cost, maintenance, lifespan data, and break-even analysis for fleet procurement decisions.
Purchase Price Comparison: Sticker Shock vs. Lifetime Cost Reality
Diesel Bus Purchase Price: A new diesel school bus or transit coach costs $110,000-$130,000 for standard configurations. This is the entry-level option for fleet operators on tight budgets. Diesel buses are mature technology with established supply chains, competitive manufacturers, and predictable pricing. There is no federal subsidy for diesel bus purchases.
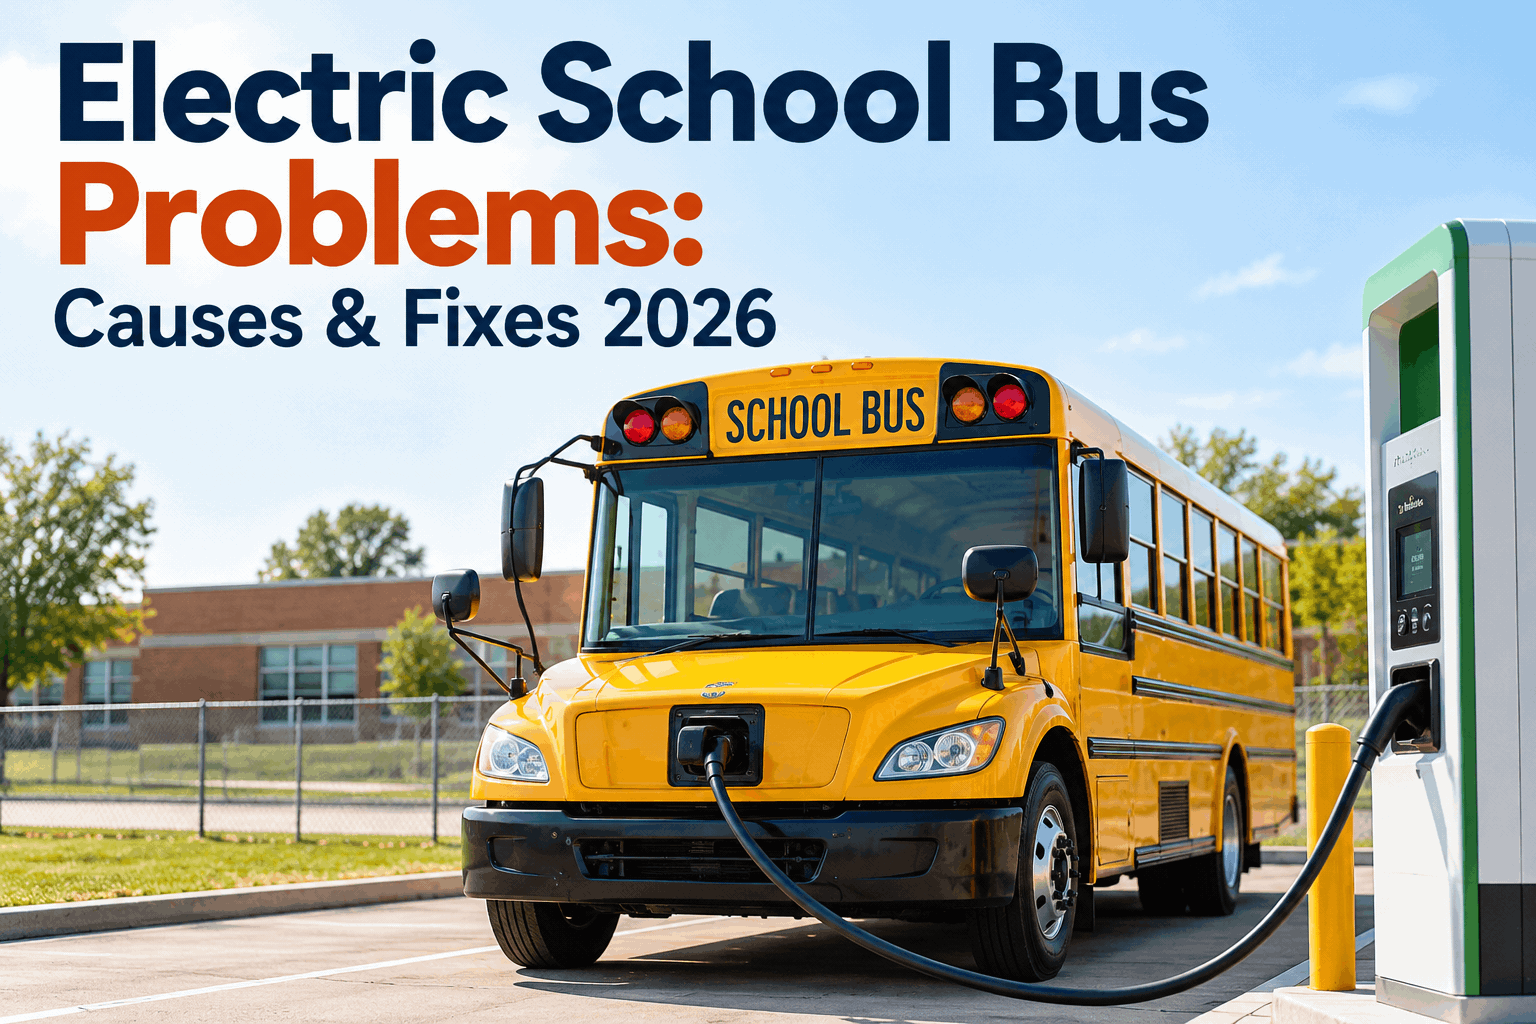
Electric Bus Purchase Price: A new electric school bus costs $300,000-$400,000—nearly three times the diesel equivalent. This higher upfront cost reflects battery technology expenses, electrical systems, and developing manufacturing scale. However, federal incentives dramatically change the equation. The EPA Clean School Bus Program provides grants and rebates: up to $325,000 per bus for priority districts (low-income, rural, tribal), and up to $170,000 for non-priority districts. For eligible districts, the net cost of an electric bus drops to $75,000-$230,000 after federal support. Through 2025, the Clean School Bus Program awarded nearly $3 billion for approximately 8,500 bus replacements.
Propane Bus Purchase Price: Propane-fueled buses cost $150,000-$200,000—higher than diesel but significantly less than electric. Propane technology is mature with established infrastructure in many regions. Some states and localities offer propane fuel incentives, but federal support is limited compared to electric programs. Propane appeals to operators seeking a middle ground: lower cost than electric with cleaner emissions than diesel.
The Critical Insight: Comparing sticker prices alone is misleading. A $130,000 diesel bus may cost significantly more over 12 years than a $350,000 electric bus that qualified for $250,000 in federal incentives. Effective bus cost = purchase price minus federal incentives. For electric buses in eligible districts, the effective purchase cost is often lower than diesel.
Fuel Cost Analysis: Diesel Volatility vs. Electric Stability
Diesel Fuel Cost Volatility: Diesel prices fluctuate dramatically based on global oil markets. Between April 2025 and April 2026, diesel fuel prices rose from $3.58 per gallon to $5.61 per gallon—a 57% increase. A typical diesel school bus consuming 5-6 gallons per day (1,300-1,500 gallons annually) faces annual fuel costs of $7,603 in 2025, rising to $11,913 in 2026. This volatility creates budget uncertainty for school districts and transit agencies: planned fuel budgets become inadequate as prices spike. For a 50-bus fleet, a $1 per gallon increase means $65,000-$75,000 in additional annual fuel costs.
Electric Fuel Cost Stability: Electricity costs are significantly more stable than diesel. Between 2025 and 2026, average electricity costs increased from $3,127 to $4,042 per electric bus annually—a 29% increase, roughly half the diesel increase rate. Electric buses save 60-75% on fuel costs compared to diesel: approximately $0.14-$0.28 per mile for electric versus $0.49-$0.82 per mile for diesel. Real fleet data shows operating costs as low as $0.19 per mile for electric buses. Over 150,000 annual miles (typical school bus), this translates to $28,500-$30,000 annual fuel cost for diesel versus $10,500-$13,500 for electric—a difference of $15,000-$17,500 per bus annually.
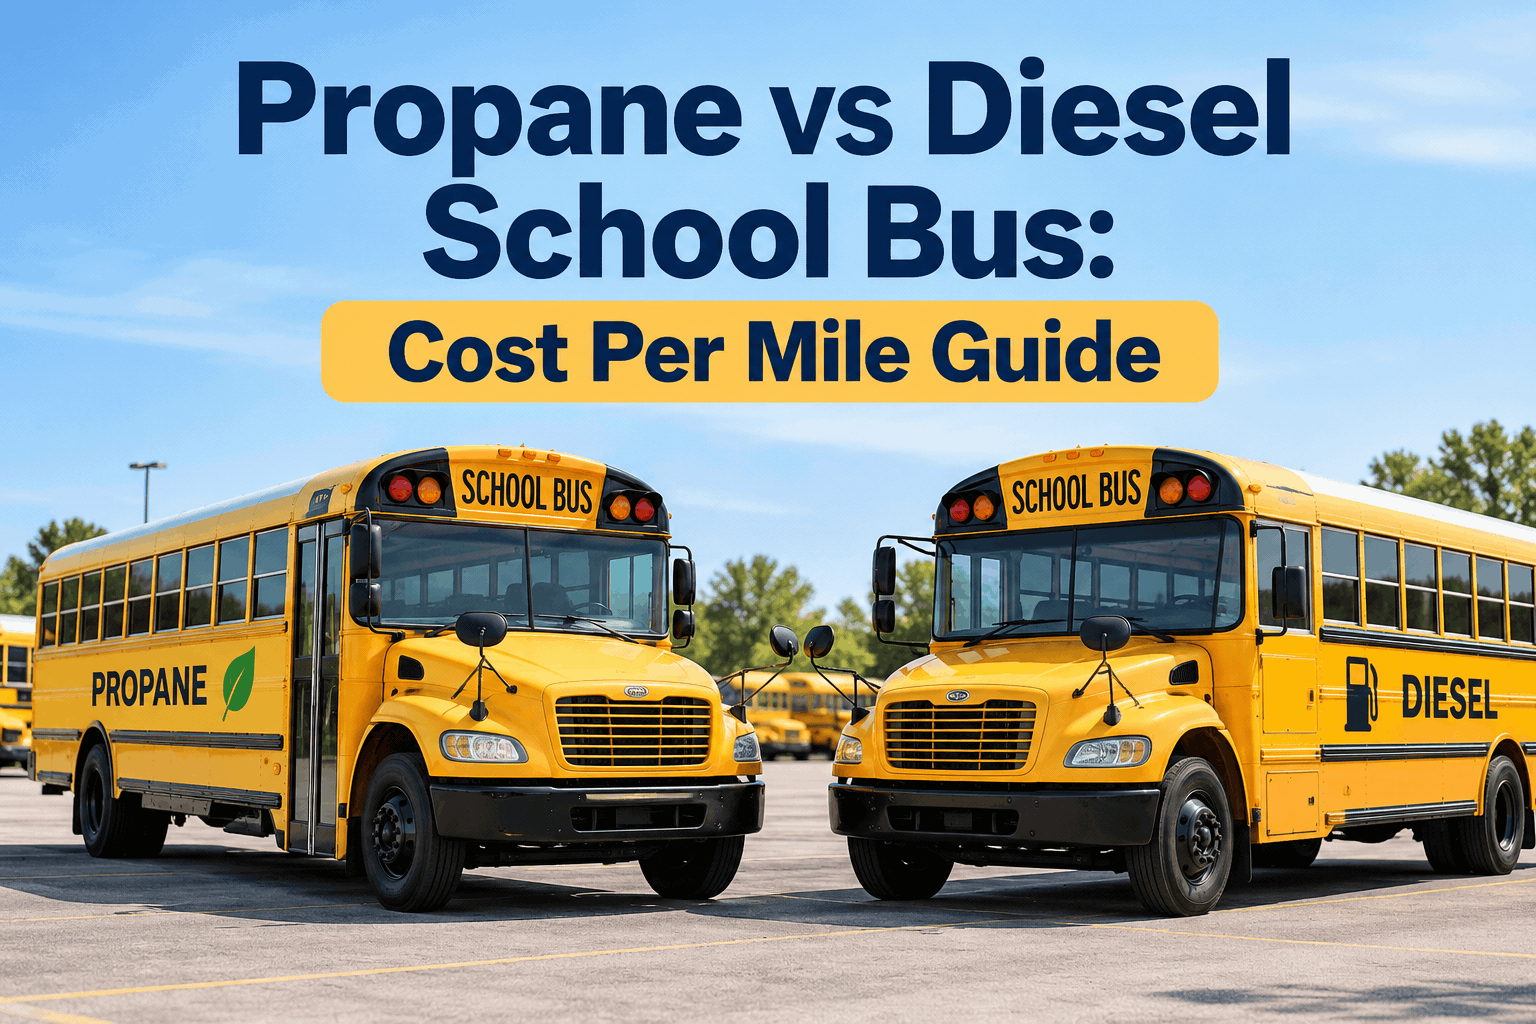
Propane Fuel Cost: Propane typically costs 30-40% less than diesel on a per-mile basis, but propane infrastructure remains limited in many regions. Propane prices are more stable than diesel but less stable than electricity. Annual propane fuel cost typically ranges $5,000-$7,000 per bus—less than diesel but more than electric.
Cumulative Fuel Impact Over 12 Years: Over a 12-year service life, fuel cost differences become dramatic. A diesel bus consuming $9,500 annually in fuel costs $114,000 in fuel. An electric bus consuming $4,500 annually costs $54,000 in fuel—$60,000 less over the lifecycle. For a 50-bus diesel fleet, replacing with electric and capturing fuel savings amounts to $3 million in cumulative fuel cost reduction over 12 years.
Annual Fuel Cost Comparison by Bus Type
| Bus Type | Daily Consumption | Annual Cost 2025 | Annual Cost 2026 | Cost Per Mile |
|---|---|---|---|---|
| Diesel | 5-6 gal/day | $7,603 | $11,913 | $0.49-$0.82 |
| Electric | 25-28 kWh/day | $3,127 | $4,042 | $0.14-$0.28 |
| Propane | 4-5 gal/day | $5,200 | $6,800 | $0.35-$0.45 |
Maintenance Cost Comparison: Diesel Complexity vs. Electric Simplicity
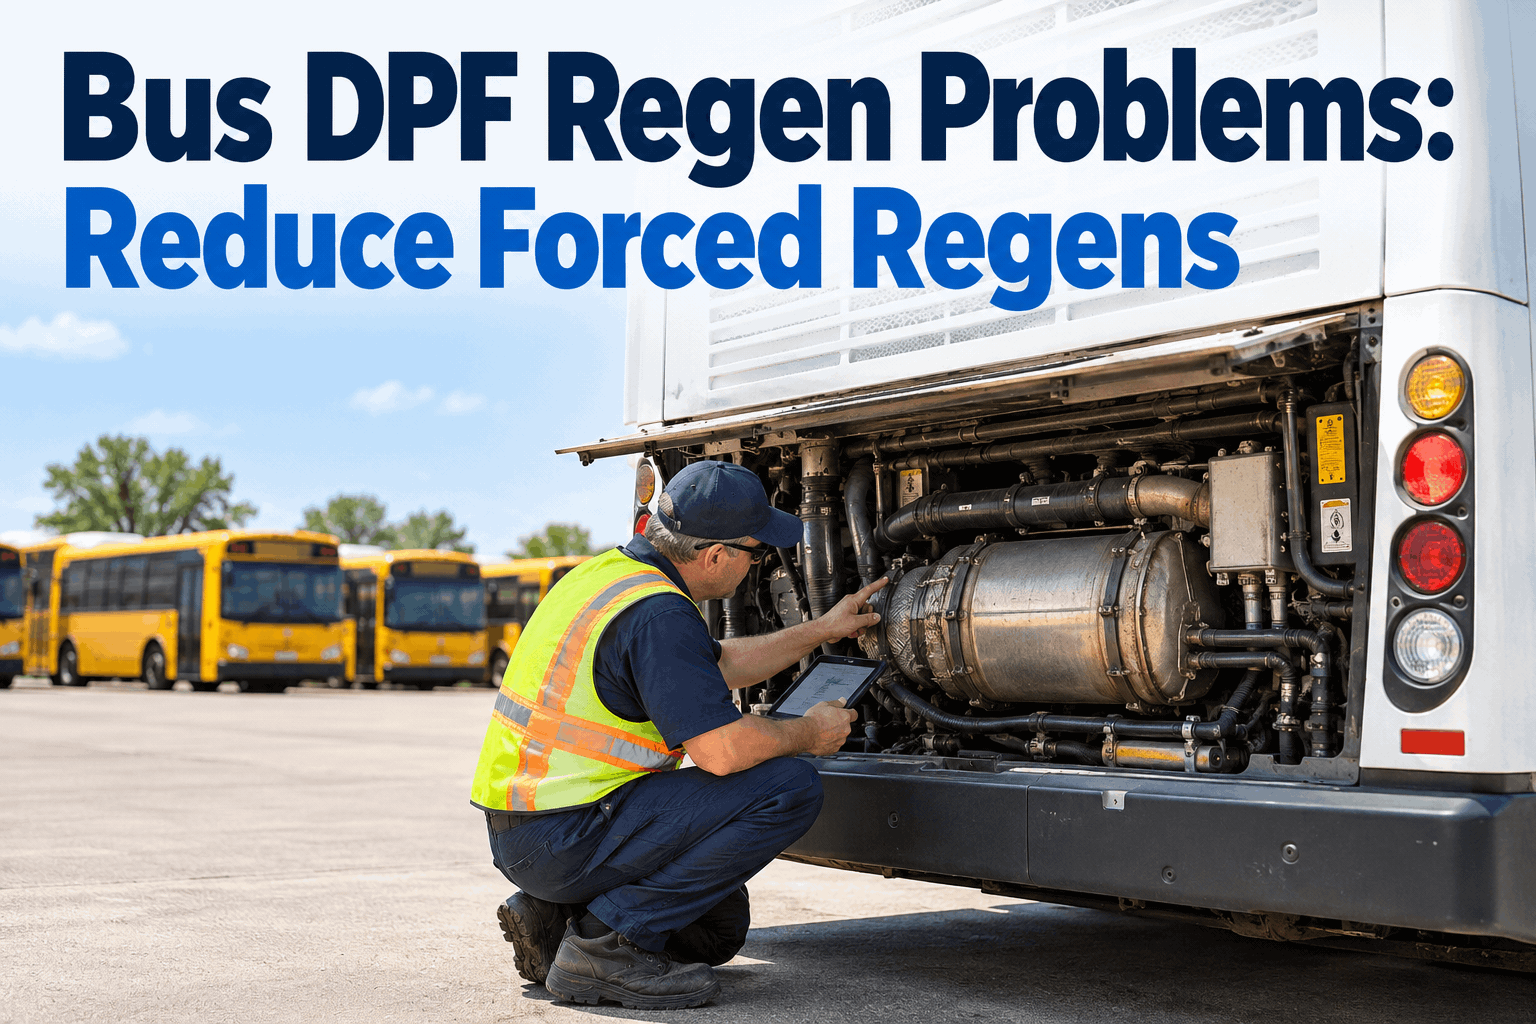
Diesel Bus Maintenance Costs: Diesel buses require extensive preventive maintenance: oil changes every 10,000-15,000 miles, transmission fluid service, coolant flushes, fuel filter replacements, exhaust system maintenance, and regular brake service. Over 150,000 annual miles, a diesel bus accumulates 10-12 oil changes yearly. Diesel engines have complex systems requiring specialized technician expertise. Annual maintenance costs typically range $2,500-$4,000 per bus depending on age, operating conditions, and technician labor costs in your region.
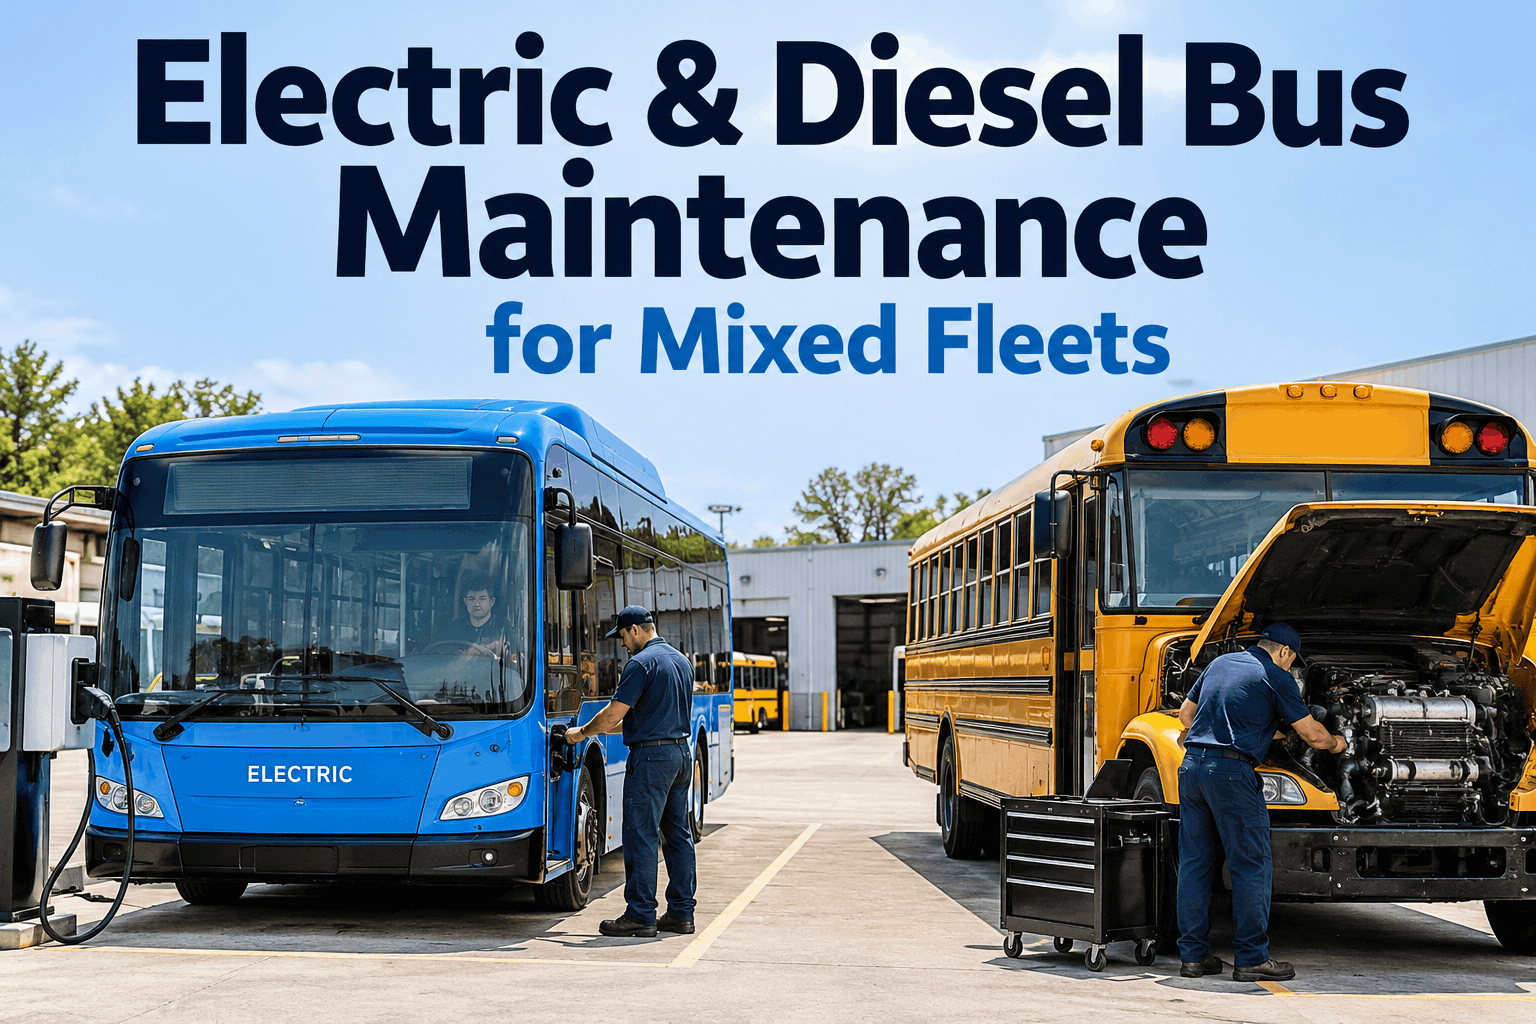
Electric Bus Maintenance Costs: Electric buses have dramatically simplified maintenance. No oil changes, transmission service, or exhaust system maintenance. Regenerative braking systems mean brake pads last 2-3 times longer than diesel buses. Battery thermal management is largely automated. Electric motor systems are fundamentally simpler than combustion engines with fewer failure points. Annual maintenance costs typically range $800-$1,500 per bus—40-50% lower than diesel. Industry data shows electric buses save $30,000-$50,000 in maintenance costs over a 12-year service life compared to diesel equivalents.
Propane Bus Maintenance Costs: Propane buses fall between diesel and electric: no oil changes (propane burns cleaner than diesel), but they require propane system maintenance including regulator service and fuel system checks. Annual maintenance typically costs $1,500-$2,500 per bus—less than diesel but more than electric.
Battery Replacement Considerations: Electric buses have battery packs that eventually require replacement. However, modern lithium-ion battery packs retain 80-85% capacity after 12 years of use. Most electric buses operate their entire service life on original batteries. When replacement is needed, battery costs have dropped 30% in three years: now approximately $175 per kWh compared to $250 per kWh in 2023. A typical school bus battery pack (100-200 kWh) would cost $17,500-$35,000 to replace—significant but often covered by extended warranties or depreciation reserves.
Infrastructure Costs and Hidden Expenses
Diesel Infrastructure: Diesel buses require minimal infrastructure investment. Existing fuel delivery networks reach most communities. Small fleets may purchase fuel at public pumps; larger fleets install onsite diesel fuel tanks. Onsite diesel tank installation costs $3,000-$8,000 with annual compliance testing. Diesel fuel is immediately accessible, requiring no special site preparation or electrical upgrades.
Electric Charging Infrastructure: Electric buses require charging infrastructure—the largest hidden cost in electrification. Level 2 chargers (slower, suitable for overnight charging) cost $5,000-$10,000 per charger. DC fast chargers (faster charging during day) cost $30,000-$75,000 per charger. A school district with 20 buses might need 5-8 charging stations depending on route patterns and duty cycle. Infrastructure costs range $50,000-$200,000+ depending on site conditions and charging capacity requirements. However, federal grants cover up to 80% of charging infrastructure costs through programs like the Bipartisan Infrastructure Law. Many districts qualify for grants covering $40,000-$150,000 of infrastructure costs, reducing net infrastructure expense significantly.
Propane Infrastructure: Propane requires less extensive infrastructure than electric but more than diesel. Propane fueling stations require special installation and regulatory compliance. Infrastructure costs typically range $20,000-$50,000 for a modest-sized fleet. Propane infrastructure availability varies by region—abundant in agricultural areas, limited in urban centers.
Technician Training and Expertise: Electric buses require technician training in high-voltage systems and battery management. Initial technician training costs $2,000-$5,000 per technician. However, electric bus maintenance is simpler overall, eventually reducing total technician workload despite specialized training investment.
Total Cost of Ownership (TCO) Analysis: 12-Year Lifecycle Comparison
Diesel Bus 12-Year TCO: Purchase price $120,000 plus fuel costs ($9,500 annual average = $114,000), maintenance costs ($3,000 annual average = $36,000), insurance (approximately $18,000 total), and resale value roughly $15,000. Total cost of ownership: approximately $273,000. Cost per mile over 1.8 million miles: $0.15. This baseline assumes average operating conditions and modest fuel price fluctuations.
Electric Bus 12-Year TCO with Federal Incentives: Purchase price $350,000 minus federal incentive of $250,000 (net $100,000) plus fuel costs ($4,000 annual average = $48,000), maintenance costs ($1,200 annual average = $14,400), charging infrastructure allocation ($15,000), insurance ($18,000), and resale value $20,000 (electric buses hold value better due to battery warranties). Total cost of ownership: approximately $175,400. Cost per mile: $0.10. The total lifecycle cost is $97,600 less than a diesel bus—despite the higher sticker price.
Propane Bus 12-Year TCO: Purchase price $175,000 plus fuel costs ($6,000 annual average = $72,000), maintenance ($2,000 annual average = $24,000), infrastructure ($8,000), insurance ($18,000), and resale value $18,000. Total cost of ownership: approximately $277,000. Cost per mile: $0.15. Propane offers modest cost advantage over diesel (approximately $4,000 lower) but significantly higher than electric.
Fleet-Level Impact: For a 50-bus fleet transitioning from diesel to electric, the total lifecycle cost difference over 12 years is approximately $4.9 million (50 buses × $97,600 lower per-bus cost). Even accounting for charging infrastructure installation, electric buses deliver superior economics over their operational lifetime compared to diesel equivalents in most scenarios.
12-Year Total Cost of Ownership by Bus Type (Single Bus)
Federal Funding Programs: Maximizing Financial Support
EPA Clean School Bus Program: This is the primary federal funding source for school bus electrification. Priority districts (low-income, rural, tribal) receive up to $325,000 per bus in grants and rebates. Non-priority districts receive up to $170,000 per bus. The program has awarded nearly $3 billion through 2025 funding approximately 8,500 bus replacements. Application deadline information and eligibility criteria are available at epa.gov/cleanschoolbus.
Bipartisan Infrastructure Law Charging Grants: The Infrastructure Investment and Jobs Act (IIJA) provides funding for charging and fueling infrastructure. Transit agencies and school districts can access grants covering up to 80% of charging station installation costs. These grants can fund $40,000-$150,000+ of infrastructure depending on project scope.
State and Local Incentives: Many states offer additional incentives for electric bus purchases. California, New York, Massachusetts, and other states provide supplementary grants or tax credits for electrification. Check your state's transportation or environmental agency for available programs.
Utility Rebates: Many electric utilities offer rebates for commercial EV charging installation (up to 25% of costs) as part of sustainability initiatives. Contact your local utility to inquire about available programs.
Total Federal Support Impact: A school district purchasing an electric bus in an eligible area can often access: $250,000-$325,000 from EPA Clean School Bus Program, plus $40,000-$80,000 from infrastructure grants, plus potential state/local incentives. Total federal support can offset 70-80% of total electrification costs, making net electric bus cost competitive with or lower than diesel buses.
Decision Framework: Which Bus Type Makes Financial Sense for Your Fleet
Choose Diesel If: Your district has severe budget constraints and cannot access federal electric bus incentives. Your routes are highly variable with unpredictable duty cycles unsuitable for electric range. You operate in a region with limited electricity infrastructure. Your fleet is already heavily invested in diesel maintenance expertise and parts inventory. You need the lowest immediate capital outlay with no grant application process.
Choose Electric If: Your district qualifies for federal Clean School Bus Program incentives covering $170,000-$325,000 per bus. Your routes are predictable with mostly return-to-base operations suitable for electric range. You have access to charging infrastructure or can install it affordably. Your operating budget is constrained (fuel and maintenance savings compound over 12 years). You prioritize emissions reduction and community health impact. You want to position your fleet as future-ready as EV adoption accelerates.
Choose Propane If: Your region has established propane infrastructure with competitive fuel pricing. You want cleaner emissions than diesel with lower cost than electric. Your district has moderate capital availability with access to state/local propane incentives. You operate primarily short-range routes where propane tank capacity is sufficient.
Consider Hybrid Approach: Many successful fleets use a mixed-fuel strategy: transition high-utilization routes to electric, maintain propane or diesel for specialized routes, and gradually increase electric as charging infrastructure expands. This phased approach manages capital costs while capturing early fuel savings benefits.
Key Financial Metrics by Bus Type
Diesel Bus: Purchase $120,000 | Annual Fuel $9,500 | Annual Maintenance $3,000 | 12-Year TCO $273,000 | Federal Incentives $0 | Typical Payback N/A
Electric Bus: Purchase $350,000 | Annual Fuel $4,000 | Annual Maintenance $1,200 | Federal Incentives $250,000 | 12-Year TCO $175,000 | Payback 3-5 years vs. diesel
Propane Bus: Purchase $175,000 | Annual Fuel $6,000 | Annual Maintenance $2,000 | Federal Incentives $0-30,000 | 12-Year TCO $277,000 | Payback 8-10 years vs. diesel
Bus Type and Cost Comparison Questions
Is a $350,000 electric bus really cheaper than a $120,000 diesel bus over 12 years?
Yes. With federal incentives reducing net electric cost to approximately $100,000, plus 60-75% fuel savings and 50% maintenance savings over 12 years, electric buses deliver total cost of ownership approximately $97,600 lower than diesel equivalents in most scenarios.
What happens if federal incentive programs end or my district doesn't qualify?
Without federal incentives, electric buses remain more expensive over 12 years, though fuel/maintenance savings still provide payback within 8-12 years depending on operating patterns. Check your district's eligibility with EPA Clean School Bus Program—most districts qualify for at least $170,000 per bus support.
How does electric bus range compare to typical school routes?
Modern electric school buses have 150-200 mile range per charge. Typical school routes are 100-150 miles daily with return-to-base at night. Electric buses are well-suited for standard school bus duty cycles. Specialized routes with 300+ miles should remain diesel or propane.
What's the cost of charging infrastructure and who pays?
Charging infrastructure costs $50,000-$200,000+ per site depending on charger type and site conditions. Federal grants through IIJA cover 50-80% of costs. Many districts access $40,000-$150,000 in infrastructure grants, reducing district net cost to $10,000-$100,000.
How long do electric bus batteries last and what's replacement cost?
Modern batteries retain 80-85% capacity after 12-year service life. Most buses operate full lifecycle on original batteries. Replacement costs approximately $175 per kWh or $17,500-$35,000 per bus battery pack—often covered by manufacturer warranties or depreciation reserves.
Are there fuel price guarantees with any bus type?
No fuel price guarantees exist, but electricity costs have historically proven more stable than diesel. Diesel volatility creates budget uncertainty—prices rose 57% from April 2025 to April 2026. Electric pricing increases were 29% in same period, making electricity more predictable for budget planning.
USA Based - Can I apply for federal incentives if I haven't purchased buses yet?
Yes. EPA Clean School Bus Program typically allows districts to apply before purchase if you meet program deadlines. Applications are available at epa.gov/cleanschoolbus. Most districts have 60-90 days to submit required documentation. Check current deadline for your funding year.
How do maintenance costs differ between bus types long-term?
Diesel: $3,000-$4,000 annually. Electric: $800-$1,500 annually (60-75% lower). Propane: $1,500-$2,500 annually. Over 12 years, electric maintenance costs are approximately $30,000-$50,000 lower than diesel, providing substantial ongoing budget relief.
When we ran total cost analysis on our fleet replacement plan, the numbers were clear: electric buses qualified for federal incentives that made them cheaper over 12 years than diesel buses. What convinced our school board wasn't just the economics—it was the certainty. With electric, we know fuel and maintenance costs won't spike unexpectedly. That budget predictability matters as much as the dollars.
Calculate Your Fleet's True Total Cost of Ownership
Stop comparing sticker prices. Modern CMMS software calculates lifetime fuel, maintenance, and operating costs by vehicle type. BusCMMS provides your actual operating data—not industry averages—to model electrification economics specific to your fleet's routes, duty cycles, and regional costs. Understand your true financial picture before procurement decisions.