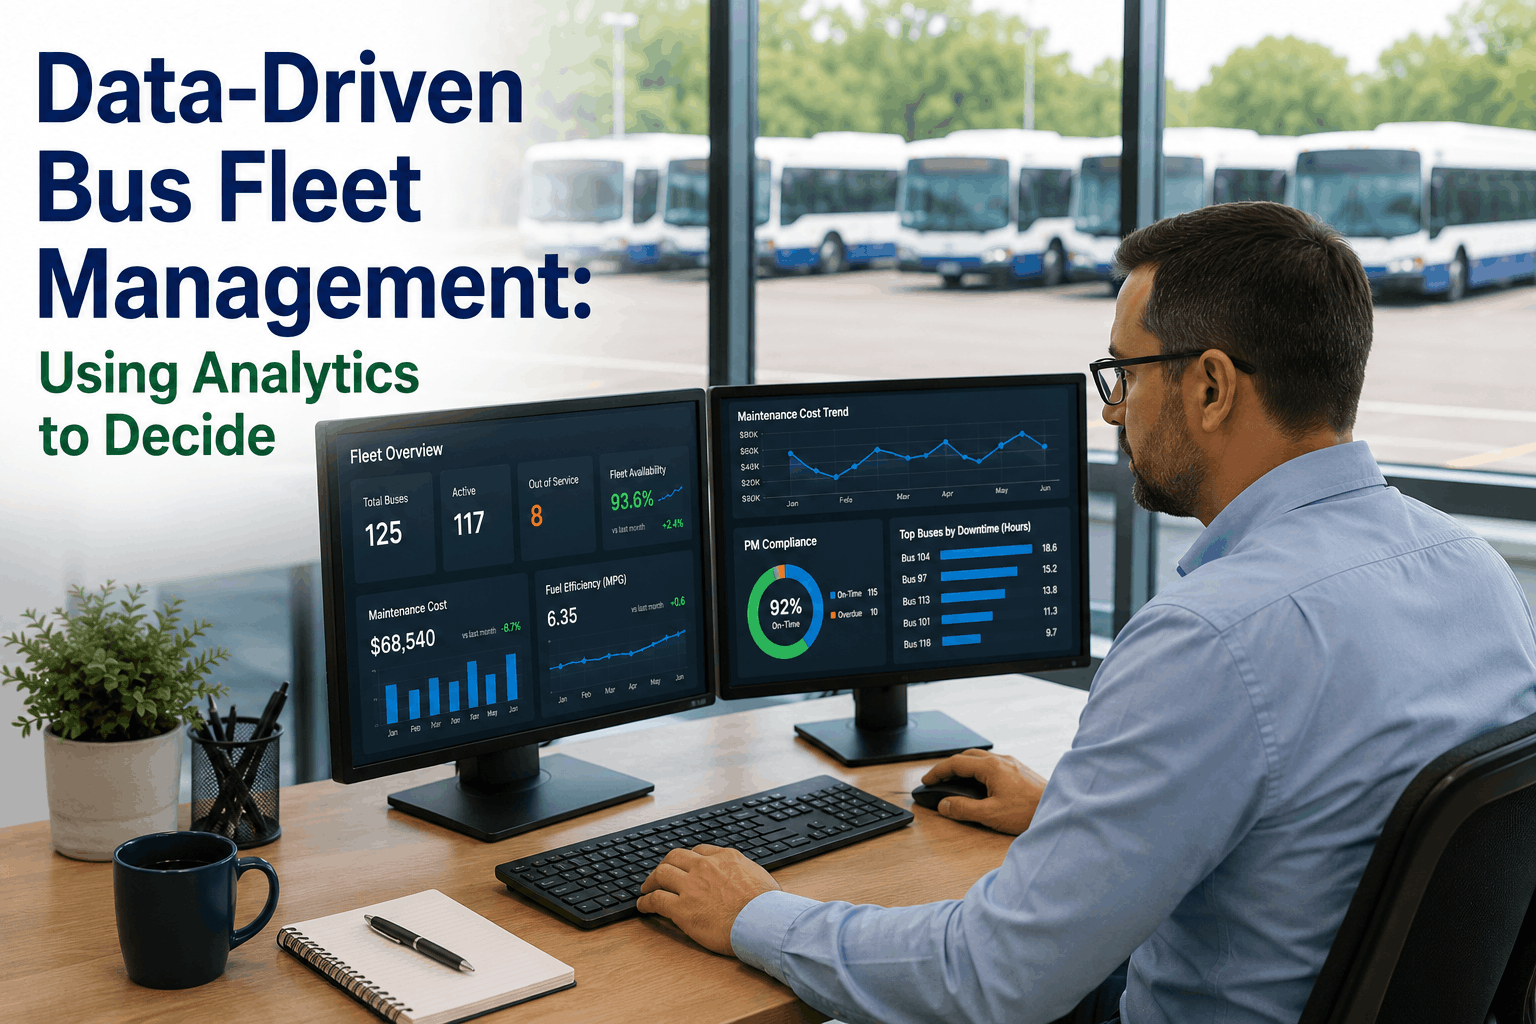
Data is the hidden asset of modern bus fleet management. Every vehicle operating on the road generates continuous streams of data: fuel consumption, engine diagnostics, driver behavior, GPS location, passenger boarding, maintenance records, and operational performance. Most bus operators collect this data but fail to analyze or act on it systematically. As a result, they miss opportunities to optimize costs, improve safety, reduce emissions, and enhance service reliability. Research from MIT's Center for Transportation and Logistics shows that fleet operators using data-driven decision-making achieve 12–18% operational cost reduction, 25–30% improvement in vehicle uptime, and 35–40% faster root-cause problem resolution compared to peers using reactive approaches. In 2026, data-driven management is no longer a competitive advantage—it is a requirement for efficient, accountable operations. Fleet management software platforms integrate maintenance records, telematics, fuel data, driver performance, and financial metrics into unified dashboards and analytics engines. Decision-makers at all levels—from the maintenance supervisor checking whether a transmission is worth repairing to the CFO allocating annual budget—can access real-time insights and forecasts. This comprehensive guide explains what data modern bus fleets should be collecting, how to transform raw data into actionable intelligence, how leading operators use analytics for strategic and tactical decisions, and how to overcome common barriers to data-driven culture within your organization.
Data-Driven Bus Fleet Management: Using Analytics to Decide
Turn fleet data into decisions. See how 2026 bus fleets use maintenance analytics and dashboards to cut costs and improve service reliability.
The Data Opportunity in Bus Fleet Operations
A 100-bus fleet generating data from vehicles, maintenance systems, telematics sensors, and operations platforms produces an estimated 50–100 gigabytes of data per month. Each vehicle generates approximately 5–10 million data points per day covering fuel consumption, engine temperature, braking events, acceleration patterns, GPS coordinates, door openings, and component diagnostics. Yet most fleets store this data in siloed systems (maintenance records in a CMMS, GPS in telematics, fuel in accounting) and never synthesize it into cohesive intelligence.
The untapped opportunity is substantial. Data reveals which drivers have safety or efficiency issues, which routes are unprofitable or inefficient, which vehicles are likely to fail in coming weeks, which maintenance contractors overcharge, and which operational practices are degrading service. Advanced analytics—trend analysis, root-cause analysis, predictive modeling, and optimization algorithms—unlock value hidden in this data. When unleashed, analytics enable precision management: decisions based on evidence, not intuition; improvements targeted to highest-impact areas, not scattered efforts; and accountability built on measurable outcomes, not blame.
Core Data Categories: What Every Fleet Should Collect
Effective data-driven management requires collecting the right data from the right sources. Here are the core categories successful fleets prioritize:
Real-time operational data: fuel consumption (gallons/hour and gallons/mile), engine speed and temperature, transmission gear and pressure, braking events and G-force, GPS coordinates and speed, idle time and duration, component health codes (engine, transmission, electrical, emissions). Source: vehicle's onboard diagnostic system (OBD-II port) via telematics device or integrated system. Frequency: continuous or per-minute sampling. Critical for: fuel economy optimization, driver behavior analysis, predictive maintenance, route efficiency assessment.
Complete maintenance history: service type (preventive, reactive, emergency), parts replaced, labor hours, mechanic who performed work, downtime duration, cost. Source: computerized maintenance management system (CMMS). Frequency: event-based (every service or repair). Critical for: predicting component failure, calculating lifecycle costs, identifying design or quality issues, bench-marking against similar vehicles.
Individual and fleet-wide driver metrics: speeding incidents, harsh acceleration/braking events, lane departure warnings, safety violations, hours-of-service compliance, customer complaints, on-time performance, fuel consumption variance from route average. Source: telematics, ELD (Electronic Logging Device), CMMS (maintenance events), operations scheduling. Frequency: per-trip or daily. Critical for: identifying unsafe drivers, optimizing incentive programs, targeting training, improving route reliability.
Route-level metrics: scheduled vs. actual trip time, on-time performance percentage, passenger count (when available), revenue collected, operational costs (fuel, maintenance, labor), uptime percentage, cancellation and substitution rates. Source: scheduling system, fare collection system, telematics, CMMS. Frequency: daily or per-trip. Critical for: route profitability assessment, schedule optimization, service quality measurement, contract performance tracking.
Operational and capital costs: fuel spending by vehicle and driver, maintenance costs by category (tires, brakes, engine), labor costs (mechanics, drivers), parts inventory costs, capital expenditure (vehicle purchases, infrastructure), cost per mile and cost per passenger-mile. Source: accounting system, fuel card, maintenance contractor invoices, CMMS. Frequency: monthly and annual. Critical for: cost optimization, budget forecasting, ROI analysis on capital investments, bench-marking against industry standards.
Regulatory and risk data: accident and incident reports, mechanical violations (DOT inspection findings), driver violations and citations, maintenance compliance (preventive service dates), hours-of-service violations, passenger injury claims, insurance claims and settlements. Source: CMMS, incident reporting system, driver files, insurance records. Frequency: event-based and annual. Critical for: liability risk assessment, regulatory compliance documentation, targeted safety improvements, insurance premium negotiation.
From Data Collection to Actionable Intelligence: The Analytics Pipeline
Collecting data is only the first step. The real value lies in transforming raw data into insights that drive better decisions. The analytics pipeline has four stages:
Raw data from multiple systems (telematics, CMMS, ELD, accounting, scheduling) arrives in different formats, with gaps, duplicates, and errors. Integration layers combine data from all sources using vehicle ID, date, and driver ID as keys. Data cleaning removes duplicates, corrects obvious errors, and flags missing data. Result: unified, clean dataset ready for analysis. Tools: data warehousing platforms, ETL (Extract-Transform-Load) software, or CMMS with built-in integration.
Analyze historical data to understand patterns and trends. Dashboards and reports answer questions like: What is our current fleet uptime? How much fuel does each route consume? Which vehicles have highest maintenance costs? What is our on-time performance trend? How do drivers compare in safety and efficiency? Descriptive analytics are backward-looking but essential for establishing baselines and identifying anomalies. Frequency: real-time dashboards for operational metrics, monthly reports for financial metrics, quarterly reviews for strategic trends.
Dig deeper into anomalies to understand root causes. When uptime drops, diagnostic analysis identifies whether it's due to mechanical failures (transmission, engine, brakes) or planned maintenance delays. When fuel costs spike, analysis determines whether it's due to driver behavior (harsh acceleration), route efficiency, vehicle condition, or fuel price increases. Root-cause analysis often involves correlating multiple data sources: maybe fuel consumption increased because a vehicle has a tire pressure issue (telematics) and the driver tends to accelerate aggressively (driver behavior data), compounding to 15% worse fuel economy. Solving one problem without the other provides incomplete benefit.
Use historical patterns to predict future outcomes and recommend actions. Predictive models answer: Which vehicles will likely fail in the next 30 days based on current diagnostics and historical failure patterns? Which routes are most likely to miss on-time targets next week given current performance and schedule? Which drivers are at elevated safety risk based on recent behavior trends? Prescriptive recommendations follow: "Vehicle #42 shows transmission temperature trending upward—recommend transmission fluid sampling and analysis within 2 weeks to prevent failure." "Driver Jones had 8 harsh braking events last week vs. fleet average of 2—recommend coaching session and review of Route 15 conditions." Predictive analytics prevent reactive emergency repairs, enable proactive scheduling, and reduce surprises.
Key Performance Indicators (KPIs) for Data-Driven Fleet Management
Effective dashboards and decision-making revolve around clear, measurable KPIs. Leading fleets track these core metrics:
% of available vehicles ready for service on any given day. Target: 92–95%. Trend: should improve month-over-month as maintenance culture strengthens. Drivers: maintenance quality, parts availability, schedule adherence.
Average miles between unscheduled breakdowns. Target: 10,000+ miles (higher is better). Industry average: 5,000 miles. Improvement indicates better preventive maintenance and vehicle condition.
Miles per gallon for diesel/CNG buses or kWh per mile for electric. Track by vehicle, driver, and route. Target: industry standards vary by vehicle type; focus on trends. Degradation indicates driver behavior issues or mechanical problems. Optimization opportunity: 5–12% improvement through driver coaching and preventive maintenance.
Total operational cost divided by miles operated. Includes fuel, maintenance, labor, parts, overhead. Industry average: $0.60–$0.85/mile depending on vehicle type and region. Target: reduce by 1–2% annually. Leading fleets: $0.40–$0.50/mile.
% of trips departing or arriving within 1–5 minutes of schedule (define threshold). Target: 92–95%. Drivers: vehicle reliability, driver skill, schedule feasibility, traffic patterns. Improvement directly correlates with customer satisfaction and revenue.
Annual maintenance spending divided by miles operated. Industry average: $0.35–$0.50/mile. Target: reduce through preventive maintenance. Spikes indicate vehicles reaching end of life or service quality issues.
Weighted metric combining speeding incidents, harsh braking, lane violations, and safety events. Target: 85+ out of 100 (normalized). Trends and outliers identify coaching needs and safety culture effectiveness.
Total operational cost divided by passenger-miles served. Reflects both operational efficiency and ridership. Trend declining over time indicates improving productivity and service value.
Real-World Applications: How Analytics Improve Decisions
Data analytics creates value when converted into specific decisions. Here are scenarios showing how leading fleets use data to improve operations:
Dashboard shows Revenue per Route and Cost per Route. Route 7 has been losing money for 6 months. Analysis reveals: fuel consumption is 20% above similar routes (vehicle condition issue), on-time performance is 78% (schedule is too tight), and driver turnover on the route is high (dissatisfaction signal). Recommendation: inspect vehicle for mechanical issues, add 5–8 minutes to schedule, review driver feedback and compensation. After correction, Route 7 improves OTP to 93% and reduces operating cost by $2,100/month. Without data, the route might have been eliminated, losing viable service and blaming drivers/vehicle when the problems were fixable.
Predictive model identifies Vehicle #34 with transmission fluid temperature increasing and fuel economy declining 8% over 3 weeks. Historical data shows vehicles with this pattern fail completely within 2–4 weeks. Recommendation: pull vehicle from service, perform transmission fluid sampling and analysis. Sampling reveals metal particles indicating internal wear. Transmission fluid and filter are replaced (cost: $500, time: 2 hours) before catastrophic failure. Prevents: $25,000+ emergency transmission replacement, 2–3 days downtime, stranded passengers, emergency overtime labor. This single prediction prevents more cost than a year of software investment.
Dashboard shows Driver Performance Composite Score. Driver A is 18 percentile (excessive speeding, harsh braking, lane violations). Driver B is 92 percentile (smooth, safe operation). Analysis shows Driver A consumes 24% more fuel than Driver B on identical routes, suggesting aggressive driving. Comparison of their telematics data shows Driver A's harsh braking events (30/week vs. Driver B's 2/week) and acceleration patterns. Recommendation: assign Driver A to Driver B for mentoring, provide targeted coaching on smooth acceleration/braking, implement feedback coaching using telematics (real-time alerts in vehicle). Result: Driver A's fuel consumption improves 18% within 4 weeks, safety score increases, and retention improves (driver feels supported, not punished).
Analytics show Maintenance Cost Per Mile for each vehicle across the fleet. Vehicles maintained by Contractor A average $0.52/mile; vehicles by Contractor B average $0.38/mile, yet vehicle condition and uptime are comparable. Parts cost variance is also high: Brake Pad Model X is $180 per set vs. equivalent Model Y at $95. Analysis examines whether cheaper parts have higher failure rates (they don't). Recommendation: renegotiate with high-cost contractor, standardize on lower-cost brake pads, consolidate vendor base. Result: maintenance cost per mile drops 12% annually, total savings $150,000+ annually for a 100-bus fleet without sacrificing quality.
Lifecycle cost analysis compares Vehicle Model A (10-year-old, $0.85/mile maintenance cost, 82% uptime) vs. New Model B ($0.40/mile maintenance cost, 96% uptime, $400,000 purchase cost). Analysis calculates: Model A is 80,000 miles from major overhaul (expected within 12 months), likely to exceed $0.95/mile in final years, and retirement is justified. Model B shows 6-year payback on capital investment via operational savings. Recommendation: retire Model A vehicles, procure Model B replacements. Decision is evidence-based, not emotional, and supports strategic fleet modernization planning.
Building a Data-Driven Culture in Your Organization
Technology alone does not create data-driven organizations. Culture, incentives, and capabilities must align. Here is how leading fleets build data literacy and decision-making discipline:
Leaders must visibly commit to data-driven decision-making. Decisions should be justified with data; anecdotes and intuition are insufficient. When a major decision is made without data (or against data), explain why—sometimes intuition is right, but the exception should be rare and intentional, not the norm. Set clear expectation: "Our organization makes decisions based on evidence."
Not everyone needs to be a data scientist, but all managers should understand how to read and interpret dashboards, spot trends, ask questions, and challenge assumptions. Conduct quarterly "data literacy" training sessions: explain what metrics mean, how to identify anomalies, how to ask analytics team for deeper dives. Over time, comfort with data increases and requests become more sophisticated.
Place uptime, cost, safety, and performance dashboards on operations center screens where team members see them daily. Hold weekly operations meetings where managers review trends together. Monthly analytics meetings dive deeper into specific questions. Quarterly business reviews connect operational metrics to strategic goals. Visibility makes metrics salient and creates shared accountability.
Assign or hire a data analytics role (analyst, coordinator, or business intelligence specialist) responsible for maintaining dashboards, responding to ad-hoc data questions, and proactively identifying improvement opportunities. This role is not a back-office function—they should attend operations meetings, understand business questions, and speak the language of both data and operations.
Align performance incentives with desired outcomes. If uptime is a strategic goal, tie a portion of maintenance team bonuses to uptime achievement. If fuel efficiency matters, reward drivers with good fuel economy. If safety is priority, incentivize safe driving scores. Incentives create alignment between individual effort and organizational goals.
Data-driven decisions are only as good as underlying data. Establish data quality standards: CMMS work orders must be completed within 24 hours, telematics devices must have 95%+ data capture, fuel card spending must be coded correctly. Audit data quality monthly. Educate staff that data integrity is their responsibility, not IT's problem.
Encourage hypothesis-driven experiments: "We predict that increasing preventive maintenance frequency on transmission will reduce emergency failures by 30%. Let's try it on 10 vehicles for 6 months and measure outcome." Experiments that don't work out are learning, not failures. Celebrate curiosity and willingness to test ideas, even if results disappoint.
Common Barriers to Data-Driven Management and How to Overcome Them
Customer Impact: How Data-Driven Operations Transformed a Fleet
Three years ago, we operated reactively. Buses broke down, we fixed them. Costs were high, uptime was low, and we had no idea why. We invested in a CMMS integrated with telematics and committed to weekly data reviews. Year one: identified unprofitable routes and improved schedules, diagnosed vehicle condition issues early and prevented major failures, and established baseline metrics showing 85% uptime and $0.68/mile cost. Year two: preventive maintenance discipline improved; we achieved 92% uptime and reduced cost to $0.58/mile. Year three: predictive analytics prevented 4 major vehicle failures, optimized vendor contracts saving $180,000 annually, and achieved 94% uptime with $0.52/mile cost. The cultural shift is profound—decisions now flow from data, not politics. Staff trust analytics because they see results. Our passengers notice too—we cancel fewer trips, show up on time more consistently, and earn their trust back. Data-driven management transformed our operations from survival mode to strategic advantage.
Frequently Asked Questions About Data-Driven Fleet Management
Start with CMMS maintenance records, telematics (fuel, engine diagnostics, idle time), driver performance (speeding, harsh braking), and operational metrics (uptime, on-time performance). These five data sources cover 80% of opportunities. Expand to financial integration and passenger data as you mature. Begin with what you have; perfection is not required.
Typical payback is 12–18 months. Quick wins appear within 3–6 months (identifying maintenance inefficiencies, optimizing routes, preventing one major failure). Sustained improvements accumulate over time (culture change, process optimization). Most fleets realize 3:1 to 5:1 return within 24 months.
Yes, absolutely. Smaller fleets have less data volume but higher per-vehicle impact of problems. A single preventable failure in a 20-bus fleet is 5% capacity loss vs. 1% in 100-bus fleet. Data-driven management scales to any size. Use cost-effective CMMS platforms and focus on high-impact metrics.
Transparency is critical. Explain to drivers that telematics is used to improve safety and efficiency, not to punish individuals. Focus on coaching and support, not surveillance language. Comply with all privacy regulations (state and federal). Many drivers appreciate telematics when they understand it's for their protection and improvement, not control.
Fleet Uptime or Mean Time Between Failures (MTBF). Improving uptime directly impacts revenue, passenger satisfaction, and cost. It is a comprehensive metric touching maintenance quality, scheduling, driver care, and parts availability. Improvement in uptime usually brings improvements in other metrics as well.
Operational metrics (uptime, fuel consumption, idle time) should update daily or near-real-time and be reviewed in weekly operations meetings. Financial and maintenance metrics update monthly and are reviewed in monthly business reviews. Strategic trends are reviewed quarterly. Real-time visibility enables rapid response; strategic reviews drive long-term planning.
Yes, lifecycle cost analysis is one of analytics' clearest applications. Track maintenance cost per mile, uptime trend, and major component health. When maintenance cost per mile exceeds 70–80% of replacement cost, or when vehicles frequently miss availability targets, retire is usually more cost-effective than continued repair.
BusCMMS integrates maintenance records, telematics, driver performance, operational metrics, and financial data into unified dashboards and analytics. Built-in KPI tracking, trend analysis, and predictive alerts enable data-driven decisions at all levels. Reports support strategic planning, budgeting, and regulatory compliance. Schedule a demo to see how your fleet can unlock data value and improve operations.
Unlock Your Fleet Data and Drive Better Decisions
Data is your hidden asset. Every vehicle generates continuous streams of operational intelligence. Modern fleets integrate this data into unified platforms, analyze it systematically, and make decisions grounded in evidence. The result: 12–18% operational cost reduction, 25–30% uptime improvement, and measurable competitive advantage. Start with core metrics, build analytics capability progressively, and create a culture where data informs every decision. Your passengers, your staff, and your bottom line will benefit immediately.







