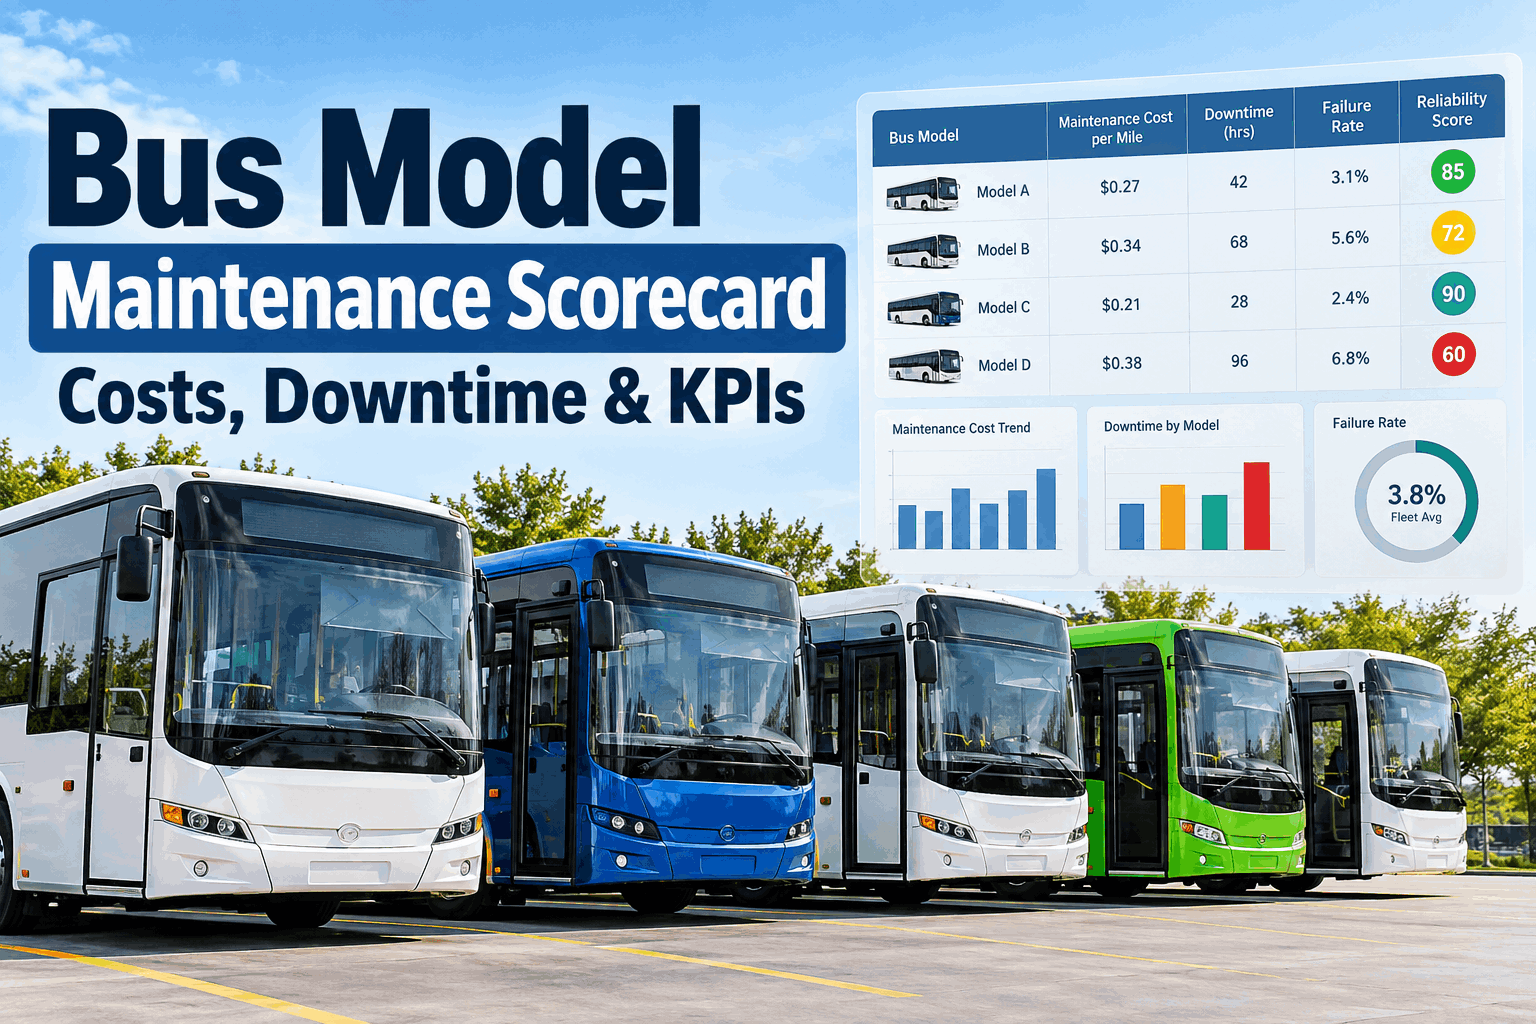
A fleet-wide maintenance average can look healthy while one bus model quietly absorbs more repair dollars, spends more days out of service, and returns with the same failures. A bus model maintenance scorecard separates those patterns by model so fleet, maintenance, and procurement teams can compare cost, downtime, reliability, and failure behavior on a consistent basis. The objective is not to crown a winner from one number—it is to understand why models perform differently and where action will have the greatest operational value.
Stop Letting Fleet Averages Hide Expensive Bus Models
Compare bus models across maintenance cost, downtime, failures, cost per mile, and reliability—then drill into the maintenance history behind the numbers.
One Fleet Average Can Conceal Three Very Different Maintenance Stories
Fleet-wide totals are useful for budgeting, but they can blur differences in model age, duty cycle, mileage, component design, parts availability, and recurring failure patterns. A model-level scorecard changes the unit of analysis: instead of asking whether the fleet is expensive to maintain, it asks which models are driving the cost and what maintenance events are responsible.
A single number looks manageable—but it does not show the distribution underneath.
The value comes from being able to move from the model summary into the underlying vehicle and work-order history. See how BusCMMS organizes model-level maintenance reporting.
Give Every Model the Same Four-Lens Performance Review
A useful scorecard balances financial and operational measures. Cost shows what the model consumes. Downtime shows how long maintenance affects availability. Failure data reveals frequency and recurring problems. Reliability adds the operating perspective. Reviewing these together prevents one attractive metric from masking another problem.
Repair spend, labor, parts, cost per mile, and major component expense.
Maintenance downtime, long-duration repairs, and time waiting for parts.
Failure frequency, repeat repairs, systems affected, and recurring defects.
Distance, service, or operating intervals between relevant failures.
Normalize Maintenance Cost Before Comparing Models
Total repair dollars alone can mislead. A model with more vehicles or more miles will naturally accumulate more cost. Maintenance cost per mile creates a common denominator by dividing the maintenance cost included in your analysis by the mileage for the same population and period. The important part is consistency: use the same cost categories and date range for every model.
Once the denominator is trustworthy, cost trends become more meaningful. Start building connected vehicle cost and maintenance histories in BusCMMS.
Look Beyond Downtime Hours and Find When Availability Is Being Lost
Two models can accumulate similar downtime totals in very different ways. One may experience frequent short repairs while another has fewer events but long parts or component delays. A calendar-style view helps managers see clusters, prolonged outages, and whether downtime is concentrated in a small group of buses.
Separating active repair time from parts, approval, vendor, or other waiting time makes the corrective action clearer.
Do Not Stop at Failure Count—Find the Systems Creating the Pattern
A model with a higher failure count deserves a second question: what is failing? Grouping repair events by system or component can reveal whether the problem is broad or concentrated. Repeated electrical, cooling, brake, HVAC, door, or powertrain work can point to different maintenance, training, stocking, warranty, or procurement responses.
Illustrative failure population
How often does the event occur?
Does the same bus return for the same issue?
Which component family drives the pattern?
What labor and parts follow the failures?
How much availability is lost?
Plot Models on Two Dimensions Before You Decide Where to Investigate
Cost and reliability answer different questions. A model can be inexpensive but unreliable, reliable but costly when it does require repair, or weak on both dimensions. A simple quadrant helps fleet leadership identify which combinations deserve deeper analysis without pretending the chart alone determines a purchasing decision.
Reliable operation with higher maintenance expense.
Lower cost with stronger reliability pattern.
Higher cost combined with weaker reliability.
Lower cost but reliability needs investigation.
Model analytics become much more useful when the chart can open the underlying repair history. Book a BusCMMS demo to see fleet analytics and maintenance reporting together.
Track How a Model's Maintenance Burden Changes as the Fleet Ages
A snapshot can miss an important lifecycle trend. Newer buses may have warranty support and fewer age-related repairs, while older units can accumulate component replacements and longer downtime. Reviewing cost and failure behavior by age band helps distinguish a temporary issue from a pattern that grows as the model matures.
Establish normal PM and warranty history.
Watch repeat systems and cost-per-mile movement.
Identify major component and downtime growth.
Compare continued maintenance with replacement planning.
Use actual vehicle history to determine whether maintenance cost is stable, episodic, or accelerating with age.
Bring Maintenance Evidence Into Future Bus Specifications and Purchases
Model scorecards are not only maintenance reports. They can give procurement teams evidence about recurring repairs, parts consumption, downtime, serviceability, and lifecycle behavior. That history can improve questions asked during future evaluations while keeping acquisition decisions broader than maintenance cost alone.
Costs, failures, labor, downtime
Normalize and compare patterns
Explain causes and operating context
Use evidence in future evaluation
Failure history, parts use, repair labor, downtime, recurring systems, and serviceability observations.
Warranty coverage, parts support, component access, training, expected service intervals, and lifecycle support.
Keeping that evidence connected to each bus makes future model analysis easier. Start organizing fleet maintenance history in BusCMMS.
What to Validate Before Comparing One Bus Model With Another
A bus model maintenance scorecard is most useful when it makes differences visible without oversimplifying them. Use the scorecard to identify where to investigate, then use the underlying maintenance records to explain the pattern and decide what operational response makes sense.







