Bus fleet uptime—the percentage of vehicles available and operational during scheduled service periods—is the foundational metric of transit operations. A fleet operating at 95% uptime is significantly more reliable than one operating at 85%. The difference in passenger experience, revenue capture, and operational efficiency is substantial. Yet many bus operators struggle to maintain uptime above 85%, losing vehicles to preventive maintenance backlogs, reactive repairs, and inadequate maintenance culture. Industry data from the American Public Transportation Association (APTA) shows that fleets achieving 92–95% uptime report 15–25% lower operational costs per mile, 30–40% fewer customer complaints, and 20% better on-time performance. The drivers of high-uptime fleets are cultural, not technical: systematic preventive maintenance, data-driven decision-making, accountability at all levels, and an organizational belief that reliability is everyone's responsibility. This comprehensive guide explains why uptime matters, identifies the hidden costs of downtime, shows how leading fleets build reliability culture, outlines the tactical preventive maintenance practices that prevent breakdowns, and demonstrates how fleet management software enables visibility, accountability, and continuous improvement in vehicle availability and reliability.
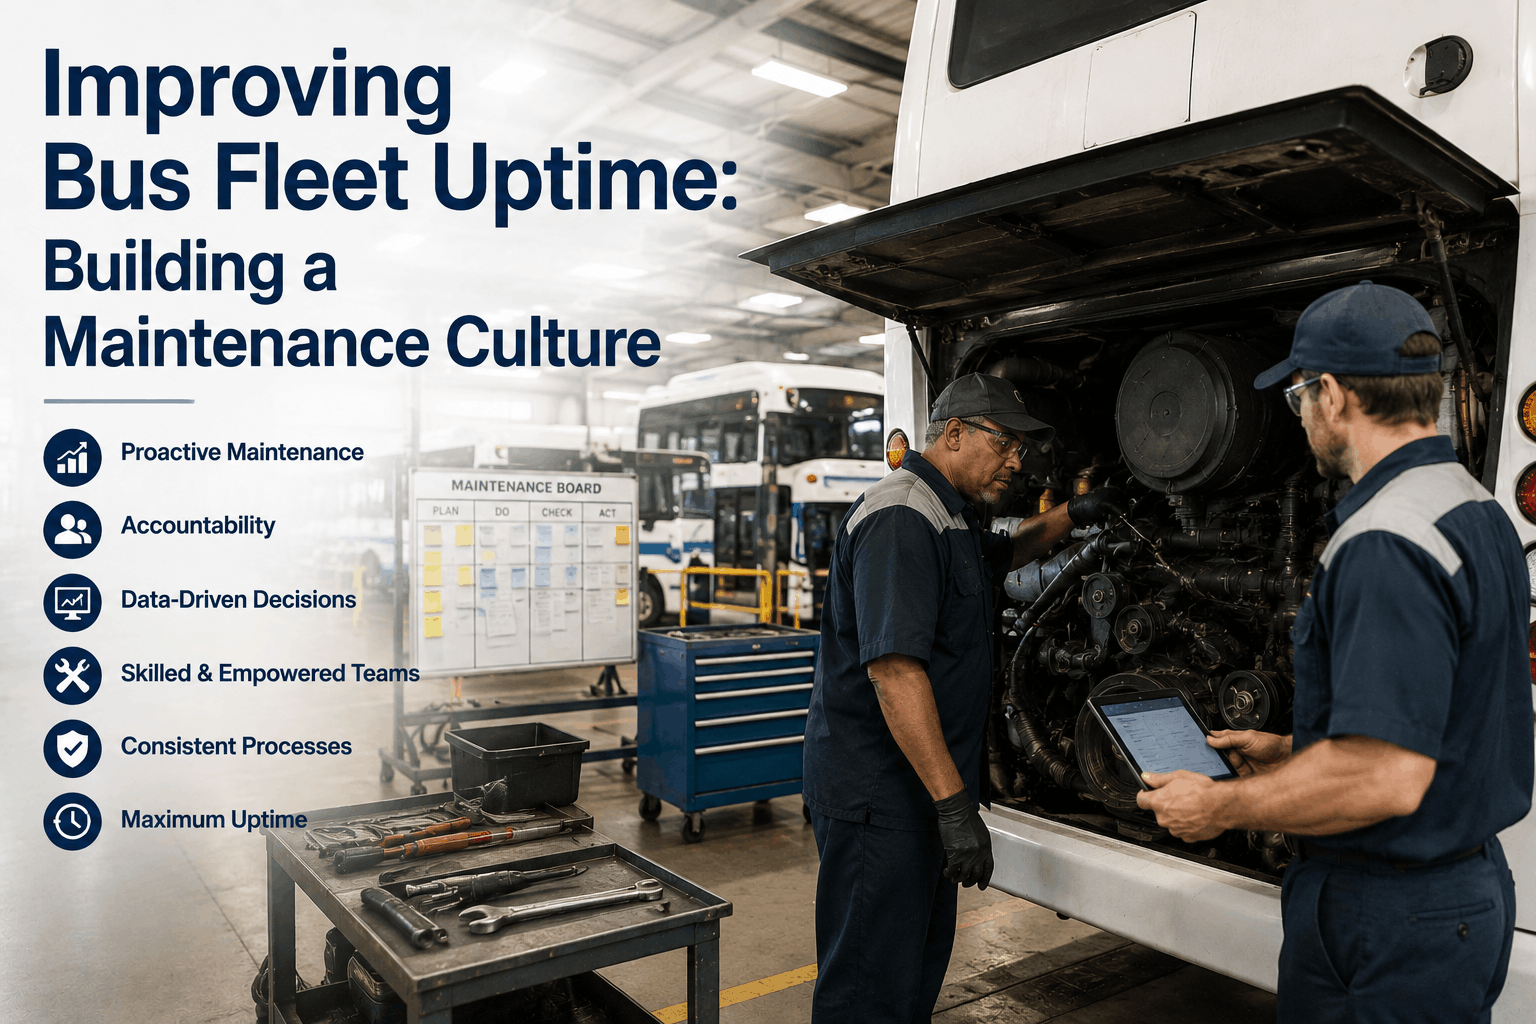
Improving Bus Fleet Uptime: Building a Maintenance Culture
Higher uptime starts with culture. Learn how leading bus fleets build accountability, data habits, and proactive maintenance routines in 2026.
The Hidden Cost of Bus Downtime
When a bus is not available for service, the costs ripple throughout the entire operation. A single bus breakdown during peak morning service can impact 50–100+ passengers, create schedule delays for connecting routes, force overtime for replacement drivers, and damage the fleet's reputation for reliability. From a financial perspective, each day a 40-foot transit bus is out of service costs the operator $800–$1,500 in lost revenue, staff overtime, maintenance charges, and schedule recovery. A 100-bus fleet operating at 85% uptime (15 buses unavailable on any given day) loses $12,000–$22,500 per day, or $4.4M–$8.2M annually. Operators at 95% uptime (5 buses unavailable daily) lose $4,000–$7,500 per day, or $1.5M–$2.7M annually. The 10-percentage-point difference in uptime represents $2.9M–$5.5M in annual loss prevention.
Beyond direct financial costs, downtime cascades into operational inefficiencies: missed trips damage community trust, passengers shift to competitors or personal vehicles, on-time performance ratings decline (affecting grant funding and contract renewals), and staff morale suffers. Maintenance teams working in reactive mode (fixing broken buses) experience high stress, overtime fatigue, and burnout—leading to turnover and further capacity loss. The most insidious cost is the hidden opportunity cost: money spent reacting to failures is money not invested in proactive maintenance, equipment upgrades, or driver training.
Preventive Maintenance: The Foundation of Uptime
Preventive maintenance is the practice of performing scheduled maintenance at regular intervals (time-based or mileage-based) before components fail. Research from the Society of Automotive Engineers (SAE) demonstrates that every dollar spent on preventive maintenance prevents $5–$7 in reactive repair and downtime costs. Modern transit buses are designed for 500,000+ miles of reliable service when preventive maintenance is properly executed. Yet many fleets skip or delay preventive tasks, believing the short-term budget savings justify the risk. This is a critical strategic error.
Driver or technician performs basic functional checks: lights, mirrors, wipers, brakes, steering, fluid levels, tire condition. Takes 10–15 minutes. Identifies obvious problems before a bus enters service. DVIR data (recorded digitally) indicates emerging issues requiring maintenance intervention.
Oil and filter change, fluid top-ups, tire rotation, belt inspection, brake adjustment. Low-cost items addressing the highest-wear components. Catching oil leaks, worn belts, and brake degradation at this stage prevents major failures downstream.
Includes A-Service items plus transmission fluid check, cooling system inspection, suspension component lubrication, and filter replacements (air, cabin). More comprehensive than A-Service. Catches transmission problems, coolant leaks, and suspension wear.
Includes B-Service items plus transmission fluid replacement, brake pad replacement, inspection of drivetrain components, and electronic system diagnostics. Addresses mid-life wear and ensures critical safety systems remain functional.
Comprehensive inspection of engine, transmission, suspension, brakes, and electrical systems. May include major component replacement or overhaul. Determines if a bus has remaining useful life or should be retired. Expensive but prevents catastrophic mid-life failures.
Depends on climate and location: winter fluid treatments, emission system inspections, EPA diesel particulate filter maintenance. Required by regulation and essential for safety and environmental compliance.
The key to preventive maintenance success is consistency and documentation. A single missed service interval can lead to component degradation that cascades into multiple failures. For example, skipping an oil change accelerates bearing wear, which eventually causes engine failure—a $30,000+ repair that could have been prevented with a $150 oil change. Many fleets implement automated maintenance scheduling in their CMMS (Computerized Maintenance Management System) that tracks mileage, sends alerts when services are due, and prevents buses from operating past service intervals.
Building Maintenance Culture: How Leaders Drive Accountability
Technical processes and tools are necessary but insufficient. High-uptime fleets build cultures where maintenance is valued, accountability is distributed across roles, and data informs every decision. Here is how successful fleets build and sustain this culture:
Fleet leaders (maintenance director, operations VP) visibly prioritize maintenance. They allocate budget adequately, defend preventive maintenance spending against short-term cost pressure, celebrate maintenance staff, and hold themselves accountable for uptime metrics. When leadership treats maintenance as a cost center instead of a strategic enabler, the entire organization reflects that mindset.
Define uptime targets (e.g., 94% by end of year) and make them visible to all stakeholders. Break targets into departmental ownership: maintenance teams own component reliability, shop ownership percentage; operations teams own driver care (rough driving accelerates component wear); planning teams own scheduling (overly tight schedules force maintenance delays). Track metrics weekly, review monthly, and celebrate progress. Transparency creates healthy competition and focuses effort.
Drivers are the first to detect emerging problems. Create feedback loops where drivers report concerns (vibrations, sounds, handling changes) without fear of punishment or dismissal. Train drivers to value vehicle care, understand how harsh driving (aggressive acceleration, hard braking) accelerates wear, and operate vehicles smoothly. Driver feedback combined with maintenance data identifies problems early and prevents failures.
Publish uptime dashboards, maintenance pipeline status, and cost metrics openly. Maintenance teams, drivers, and operations leadership see the same data. When everyone understands why a bus is down or when the next service is due, decisions become aligned. Data-driven decisions (e.g., "We had 3 transmission failures this quarter—let's increase transmission fluid change frequency") are more credible and stick better than decree.
Skilled mechanics are the backbone of uptime. Invest in technician training, certification programs, and career development. Competitive wages, benefits, and work environment reduce turnover. Cross-training ensures knowledge distribution across the team. Recognize and celebrate top performers. When mechanics feel valued and see a career path, quality improves and retention increases dramatically.
Nothing kills uptime faster than waiting for parts. Maintain strategic inventory of high-wear components (belts, hoses, brake pads, filters, seals). Use demand forecasting and supply chain management to ensure critical parts are always available. Balance between over-stocking (ties up capital) and under-stocking (causes delays). Most high-uptime fleets maintain 2–4 week supply of fast-wear items and 3–6 month supply for major components.
Implement continuous improvement practices (Lean, Six Sigma, root cause analysis) to identify why breakdowns occur and prevent recurrence. Monthly maintenance team meetings should review failures, discuss solutions, and implement changes. Solicit driver feedback on bus handling and comfort. Use failure data to predict component life and adjust service intervals. Improvement is iterative, not one-time.
Procure vehicle models strategically to minimize parts variety and technician training burden. Operating 3 different 40-foot bus models increases parts complexity, training needs, and downtime. Standardizing on 1–2 core models reduces spare parts inventory, simplifies technician knowledge, and improves repair speed. When procuring new vehicles, balance features with simplicity and reliability track record.
Predictive Maintenance and Condition-Based Monitoring
Modern fleet management systems go beyond preventive maintenance to predictive maintenance: using real-time vehicle data to predict when components will fail and schedule repair before failure occurs. Telematics sensors monitor engine temperature, transmission performance, brake wear, suspension geometry, electrical health, and fuel consumption. Abnormal patterns trigger alerts to maintenance teams.
Fuel consumption increases 5–10% before engine failure occurs. Real-time fuel tracking identifies efficiency loss. Technician is alerted to diagnose root cause (injector clogging, valve wear, sensor malfunction) before engine fails. Preventive intervention costs $500–$1,500. Emergency engine replacement costs $25,000+.
Brake pedal travel increases gradually as pads wear. Hydraulic pressure sensors detect degradation. Technician is alerted when pads reach 30% remaining life, allowing planned pad replacement before braking performance fails. Planned replacement costs $300–$500. Emergency brake failure replacement costs $2,000+ plus potential safety incident.
Fluid temperature rising above normal indicates internal wear or contamination. Shift hesitation or slipping precedes complete failure. Transmission fluid sampling reveals metal particles, indicating bearing or seal wear. Early detection allows fluid replacement or repair before transmission catastrophic failure ($15,000+).
Uneven tire wear patterns and suspension geometry drift indicate alignment or suspension problems. Vibration sensors detect emerging issues. Alignment and suspension service ($500–$1,000) prevents tire failure, improves fuel economy, and prevents suspension collapse (leading to service-out buses).
Fleet Management Software: Enabling Visibility and Accountability
Modern CMMS and telematics platforms are the nervous system of a high-uptime fleet operation. They provide visibility into maintenance status, enable automated scheduling, generate predictive alerts, and support data-driven decision-making.
System tracks vehicle mileage and usage. Automatically generates work orders when service intervals approach. Assigns work to available technicians. Prevents buses from operating past due dates. Eliminates missed services due to manual tracking gaps. Provides evidence of compliance for warranty claims and audits.
Operations centers see which buses are available for service, which are in maintenance, which are pending parts, and projected return-to-service times. Enables proactive route adjustments and passenger communication before delays occur. Visibility transforms reactive response into proactive planning.
Track spending by vehicle, maintenance type, technician, and parts supplier. Identify which vehicles are cost-outliers and address problems. Benchmark spending against industry standards. Identify if investing in a major repair or retiring an aging vehicle is more cost-effective.
Digital work orders assigned to technicians with priority, materials, and step-by-step procedures. Technicians log time and close work orders when complete. System calculates technician utilization (% time on billable work vs. idle). Identifies training needs, workload imbalances, and productivity bottlenecks. Enables fair workload distribution and recognition of top performers.
Telematics data flows into CMMS. Engine temperature trending, fuel consumption changes, brake performance degradation, and electrical anomalies trigger alerts to maintenance team. Technician can investigate before failure. Many issues are caught and corrected before affecting service.
Tracks parts inventory, reorder points, supplier pricing. Generates purchase orders automatically when inventory falls below threshold. Maintains bill-of-materials for common repairs. Reduces time searching for parts and prevents costly expedited orders.
Maintains complete maintenance history for each vehicle. Generates compliance reports (DOT inspections, emissions testing, warranty coverage). Evidence of preventive maintenance supports warranty claims, protects against liability if incident occurs, and demonstrates due diligence in regulatory audits.
Industry Benchmarking: Where Are You Against Leaders?
The American Public Transportation Association (APTA) publishes industry benchmarks for bus fleets. Here is where typical fleets stand and how leaders perform:
Case Study: How One Fleet Improved Uptime from 82% to 96%
Three years ago, our 42-bus system was operating at 82% uptime, losing buses randomly to breakdowns. Management was reactive—we fixed buses when they broke and didn't plan much beyond that. We decided to implement a comprehensive CMMS, establish preventive maintenance discipline, and build a culture where reliability was everyone's responsibility. Year one: implemented automated maintenance scheduling, set a 90% uptime target, established monthly uptime reviews with all departments present. Year two: invested in technician training, improved spare parts inventory management, and added telematics to monitor bus health. Year three: integrated predictive maintenance, achieved 96% uptime, reduced maintenance cost per mile by 32%, and eliminated the constant firefighting atmosphere. Drivers notice the difference—they say buses are more reliable and comfortable. Passengers notice—we have fewer canceled trips and better on-time performance. The financial impact is substantial: we're capturing revenue on trips that used to be canceled, maintenance costs per mile dropped, and staff burnout reduced significantly. The culture shift was the biggest challenge and the biggest payoff.
Frequently Asked Questions About Fleet Uptime and Maintenance Culture
What is a realistic uptime target for a bus fleet, and how much does culture matter versus equipment?
Realistic target is 92–95% uptime for well-managed fleets with modern vehicles. Culture accounts for 60–70% of uptime; equipment quality accounts for 30–40%. A high-uptime culture working on older vehicles outperforms a low-uptime culture with new vehicles. Leadership commitment and preventive discipline are the primary drivers.
How can we convince leadership that preventive maintenance investment will pay off financially?
Build the business case: Show current downtime costs ($X/year), current reactive maintenance costs. Project savings from preventive maintenance: $5–$7 returned per $1 spent. Calculate payback on CMMS software and technician training. Show competitors' uptime metrics and customer satisfaction advantages. Present a 3–5 year ROI that typically exceeds 300%.
What is the most important metric to track for fleet health?
Mean Time Between Failures (MTBF) and fleet uptime percentage. MTBF shows if reliability is improving or degrading. Uptime percentage shows operational impact. Both together tell the complete story. Cost per mile is secondary but important for financial accountability. Track all three weekly and review trends monthly.
Should we retire older buses or invest in major repairs to extend life?
Evaluate case-by-case using total cost analysis: annual repair costs, expected remaining useful life, fuel efficiency, emissions compliance, safety systems, and passenger comfort. If annual repairs exceed 50–60% of replacement cost or vehicle is unreliable, retirement is usually justified. CMMS maintenance data supports this decision with hard numbers.
How do we engage drivers in the reliability mission when they see maintenance as "not their job"?
Change the message: Frame drivers as "first line of defense" for vehicle health. Train them to report concerns without penalty. Create feedback loops (driver reports issue, maintenance fixes, driver informed of resolution). Celebrate reliable drivers (lower repair costs, higher availability). Explain how uptime affects their job security and schedules. Respect and recognition drive engagement.
What CMMS features are most important for improving uptime?
Automated preventive maintenance scheduling, real-time uptime dashboards, work order management with technician assignment, parts inventory tracking, and predictive alerts from telematics. Start with automation and visibility. Predictive analytics and optimization are advanced features that add value as foundation matures.
How often should we conduct major maintenance services (C, D services) on aging fleets?
Follow manufacturer recommendations as baseline. For aging buses (500,000+ miles), increase frequency by 20–30%: move D-service from 200,000 miles to 150,000–175,000 miles. More frequent deep inspection and proactive repair prevents catastrophic failures on older equipment. CMMS tracks service history and enables data-driven interval adjustments.
How does BusCMMS help us achieve higher fleet uptime and build maintenance culture?
BusCMMS provides automated preventive maintenance scheduling, real-time uptime visibility, integrated telematics for predictive alerts, work order management, and comprehensive reporting. Dashboards make metrics visible across the organization, enabling data-driven culture. Schedule a demo to see how your fleet can reach 95%+ uptime through systematic maintenance and visibility.
Transform Your Fleet Uptime and Culture Today
Higher uptime is achievable. It requires preventive maintenance discipline, leadership commitment, visibility into fleet health, and a culture where reliability is everyone's responsibility. The 10-percentage-point gap between average and excellent fleets represents millions in annual value. Start with a clear uptime target, implement systematic preventive maintenance, gain visibility with fleet management software, and build an accountability culture. Your passengers, your staff, and your bottom line will benefit immediately.