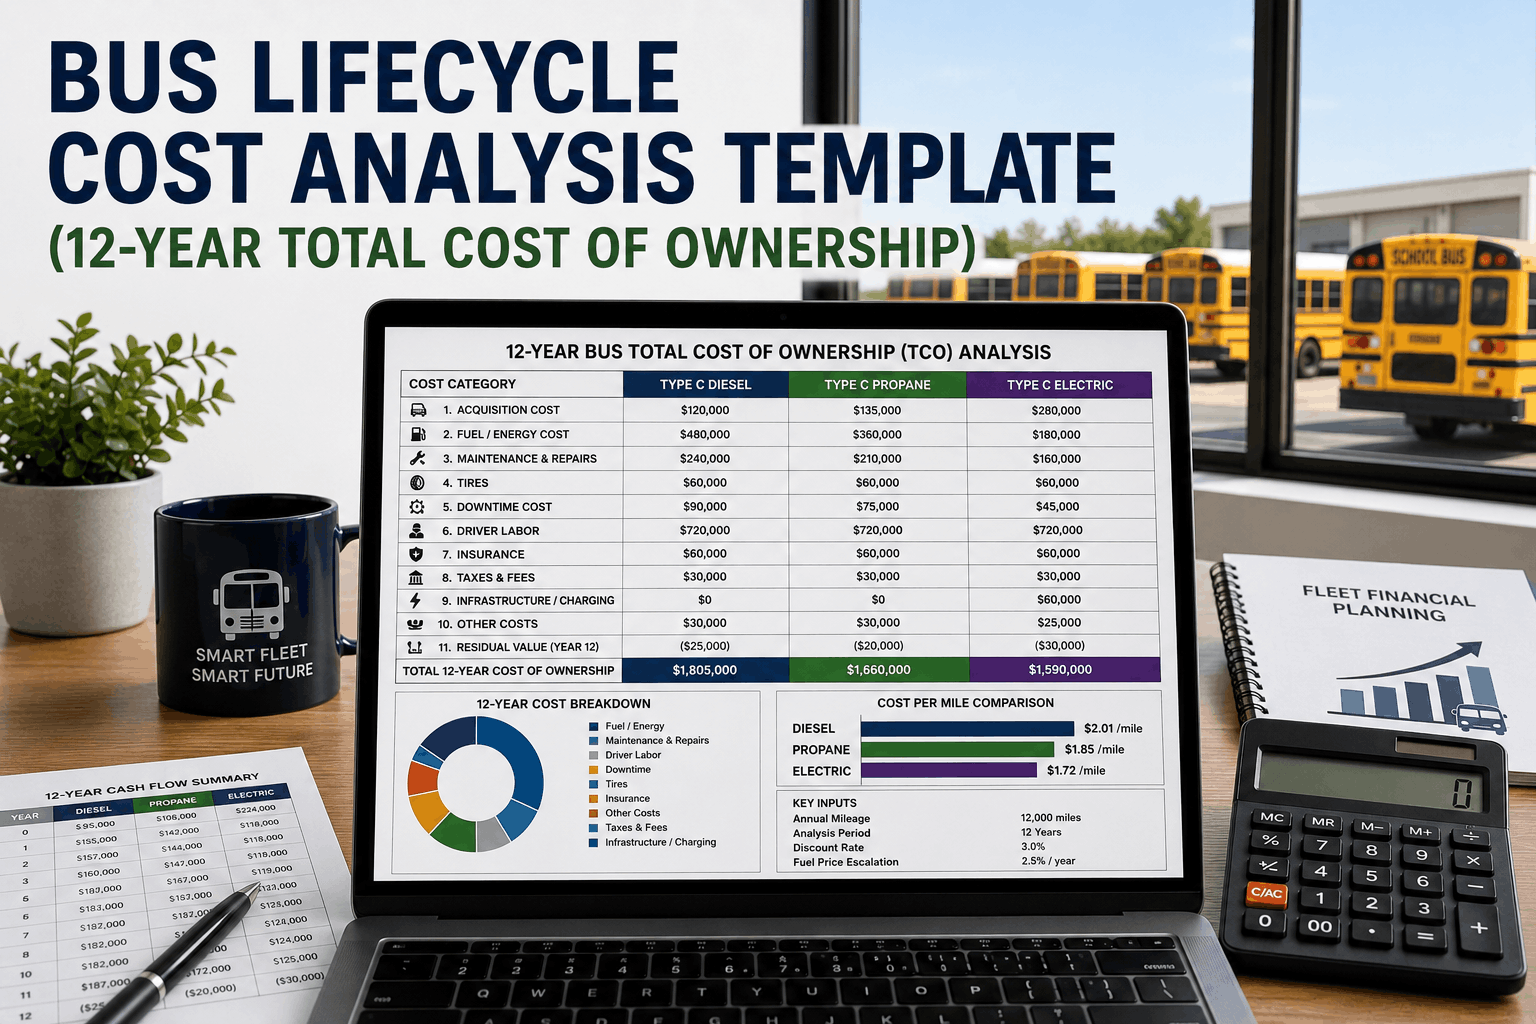
A large school district operating 210 school buses across diesel, propane, and electric powertrains needed to justify a major fleet replacement investment to its board. They had separate cost spreadsheets for fuel, maintenance, and capital purchases, but no unified view of total cost of ownership over the 12‑year lifecycle. When comparing a diesel bus against a propane or electric alternative, they found that fuel costs were easy to compare, but hidden costs like depreciation, major overhauls, downtime, and resale value were often estimated or ignored. After an initial analysis, they discovered that while electric buses had higher acquisition costs, their lower fuel and maintenance costs over 12 years resulted in a 9% lower total cost per mile compared to diesel, and propane fell in between. With a structured 12‑year lifecycle cost template, the district secured board approval for a $3.6 million electrification pilot, backed by hard data showing the long‑term financial benefit. A comprehensive TCO analysis transforms fleet replacement from a budget guess into a strategic financial model.
Bus Lifecycle Cost Analysis Template: 12‑Year Total Cost of Ownership
Compare diesel, propane, and electric buses over a full 12‑year lifecycle. Capture acquisition, fuel, maintenance, downtime, and resale in one unified TCO model.
12‑Year TCO Comparison — 210‑Bus Fleet
Diesel 12‑Year TCO per Bus
$385,000 – 420,000
Propane 12‑Year TCO per Bus
$365,000 – 395,000
Electric 12‑Year TCO per Bus
$350,000 – 380,000
Electric vs Diesel Savings
9% lower TCO
Maintenance Cost Variance (EV vs Diesel)
35‑45% lower
Resale Value After 12 Years
Diesel: 15%, Propane: 12%, EV: 10%
A full 12‑year TCO model reveals the true financial picture, enabling confident procurement and grant applications.
The Lifecycle Cost Challenge: Fragmented Views vs. Holistic TCO
Most transit agencies track fuel and maintenance costs separately, but rarely combine them with depreciation, downtime, and resale value to calculate total cost of ownership over a full 12‑year lifecycle. This fragmented view leads to decisions based on incomplete data, often undervaluing higher‑efficiency powertrains. A comprehensive 12‑year TCO template must include five core cost categories: Acquisition and Financing (purchase price, interest, grants), Fuel and Energy (diesel, propane, or electricity over 12 years), Maintenance and Repairs (routine, major overhauls, tires), Downtime and Opportunity Cost (lost revenue or charter income), and Resale Value (estimated residual value at the end of life). By projecting each over a 12‑year horizon and discounting to net present value, agencies can compare powertrains on an apples‑to‑apples basis and justify capital investments with solid financial evidence.
Incomplete Cost View
Acquisition
Sticker price only, ignoring financing and grants
Fuel
Annual pump cost, no 12‑year projection
Maintenance
Parts and oil, not labor or major overhauls
Downtime
Not quantified
Resale
Ignored entirely
Full 12‑Year TCO Template
Acquisition
Net purchase cost after grants, with financing and inflation
Fuel
12‑year forecast with annual escalation
Maintenance
All parts, labor, tires, and scheduled overhauls
Downtime
Lost revenue or rental costs assigned
Resale
Expected residual value at year 12
Critical TCO Metrics to Track Over 12 Years
A robust lifecycle cost template organizes data into five key groups. First: Acquisition and Capital—purchase price, delivery, initial training, grants, and financing costs (interest) over the life. Second: Fuel and Energy—forecast annual consumption (gallons or kWh) multiplied by projected price per unit, including taxes and delivery. Third: Maintenance and Tires—historical and projected costs for scheduled services, repairs, tires, and major component replacements (engine, transmission, battery). Fourth: Downtime and Availability—estimate lost revenue per day of unscheduled downtime, or charter replacement costs. Fifth: Resale Value—based on market data, estimate what the bus can be sold for after 12 years. By entering these inputs, the template calculates total lifecycle cost, cost per mile, and net present value, enabling side‑by‑side comparisons across powertrains.
12‑Year TCO Breakdown (Example: Type C Bus)
Diesel TCO
Propane TCO
Electric TCO
Maintenance Share (Electric)
Electric buses offer lower fuel and maintenance costs, offsetting higher acquisition over 12 years.
TCO Framework in Action: Real‑World Procurement Success
A mid‑sized transit operator with 95 buses faced a board decision to replace 30 aging diesels. The board required a full lifecycle cost analysis comparing diesel, propane, and electric options. Using a structured 12‑year TCO template, the operator gathered historical fuel and maintenance data from their fleet, researched acquisition costs after grants, and consulted market resale values. The template showed that electric buses had a 12% lower TCO over 12 years than diesel, despite 35% higher upfront cost, due to 80% lower fuel cost and 45% lower maintenance. The propane option fell between the two. The board approved the electric pilot for 10 buses, and the operator subsequently secured an FTA grant that covered 60% of the incremental cost. After two years of operation, actual costs tracked within 4% of projections, validating the TCO model and enabling the operator to confidently plan future electric conversions.
Intuitive Cost Comparison
Focus on upfront price only; fuel and maintenance guessed.
No 12‑year projection; decisions based on short‑term budget.
Board approval often difficult due to incomplete data.
Result: Delayed fleet modernization, missed grant opportunities.
Data‑Driven TCO Framework
Full 12‑year projection with all cost categories.
Clear comparison showing long‑term savings of electric.
Evidence‑based board presentations and grant applications.
Result: Successful electrification pilot, $3.6M grant secured.
Strategic Rollout: 90‑Day TCO Template Integration
Implementing a 12‑year TCO analysis process can be completed in three phases. Month one: Data Gathering and Normalization—collect purchase records, fuel invoices, maintenance logs, and downtime records for the last 3–5 years. Normalize to a per‑mile or per‑year basis. Month two: Template Configuration and Forecasting—input historical data, set assumptions for future prices (fuel, electricity, parts), and run the 12‑year model. Validate with industry benchmarks. Month three: Scenario Analysis and Reporting—run what‑if scenarios (grant levels, fuel price volatility, maintenance variations), and prepare board‑ready reports. Train finance and operations teams to update the model annually as new data emerges.
TCO Template Rollout Timeline
Days 1–30
Days 31–60
Days 61–90
Annual Update
The Bottom Line
Comparing buses solely on purchase price or annual fuel costs leads to suboptimal fleet investments. A comprehensive 12‑year lifecycle cost template that incorporates acquisition, fuel, maintenance, downtime, and resale value provides the full financial picture needed to make confident procurement decisions. By modeling total cost of ownership for diesel, propane, and electric options over a realistic horizon, you can identify the most cost‑effective powertrain, justify capital requests, and secure grant funding. BusCMMS provides the tools to build and maintain a dynamic TCO model, integrate with your operational data, and generate reports that support strategic fleet planning and stakeholder presentations.
Compare Diesel, Propane, and Electric Over a Full 12‑Year Lifecycle.
Capture all cost components, generate side‑by‑side TCO reports, and confidently select your next fleet investment. Free 14‑day trial.
Frequently Asked Questions
Why is 12‑year TCO important for bus procurement?
Buses typically operate for 12 years or more. TCO over that full period reveals that higher upfront costs of electric or propane can be offset by lower fuel and maintenance, leading to better long‑term value.
What costs are included in a full TCO analysis?
Acquisition (price, grants, financing), fuel/energy, maintenance (parts, labor, tires), downtime opportunity cost, and resale value at end of life.
How do I forecast fuel prices over 12 years?
The template uses historical trends and industry projections with adjustable escalation rates. You can set conservative, moderate, and aggressive scenarios to gauge risk.
Can the template handle different grant levels for electric buses?
Yes. You can input grant amounts and financing terms for each powertrain separately, reflecting the different incentives available for alternative fuels.
How do I account for downtime cost?
Assign a dollar value per day of unscheduled downtime (e.g., lost charter revenue or rental substitution). The template multiplies by expected downtime frequency to estimate total impact.
Can the template be used for grant applications and board presentations?
Yes. The structured output includes clear summaries, cost breakdowns, and NPV calculations that are ideal for grant narratives and board‑friendly reports.
Bring Your Fleet Investment Decisions Into a Data‑Driven, Full‑Lifecycle Framework.
Compare diesel, propane, and electric over 12 years, capture all costs, and justify your next procurement with confidence. Free 14‑day trial.