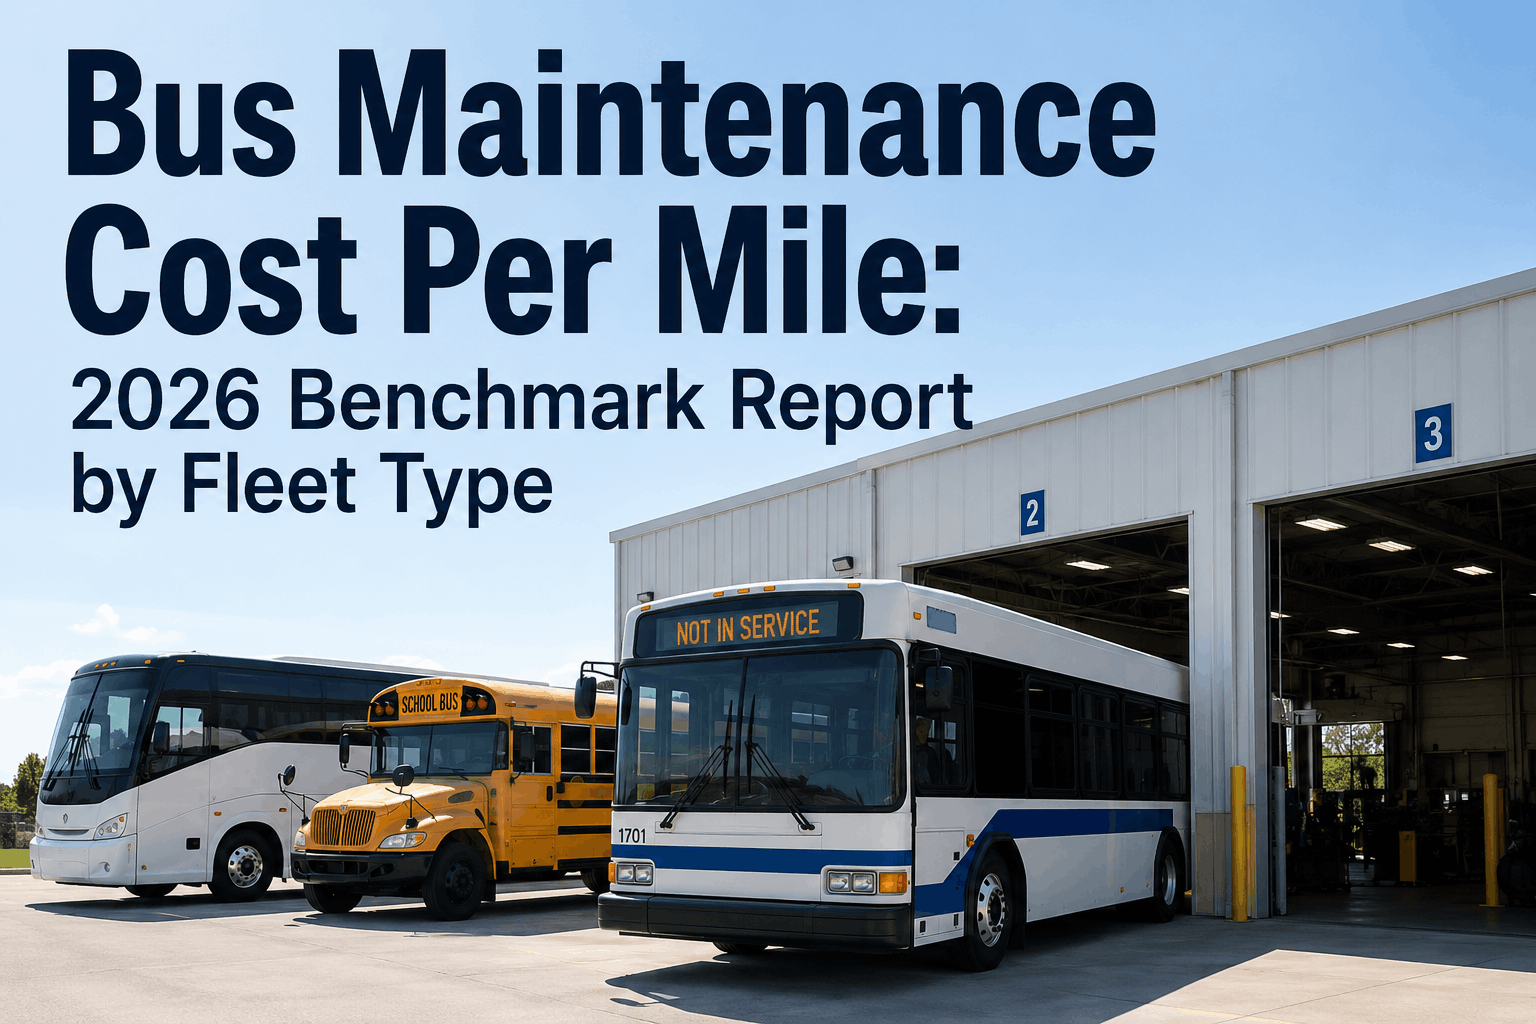
In 2026, bus fleet operators face unprecedented maintenance cost pressures. According to industry benchmarks, the average bus maintenance cost per mile ranges from $0.85 to $1.35 depending on fleet type, age, and operating conditions. School bus fleets average $0.95 per mile, transit agencies report $1.15 per mile, and charter operations spend $1.05 per mile on maintenance alone. These costs represent 18-22% of total fleet operating expenses and directly impact profitability, route sustainability, and service reliability. Understanding your cost-per-mile benchmark is critical for budget forecasting, fleet replacement decisions, and identifying cost reduction opportunities. Fleets implementing CMMS (Computerized Maintenance Management System) software reduce maintenance cost per mile by 25-35% through predictive maintenance scheduling, inventory optimization, and elimination of emergency repairs. This comprehensive benchmark report analyzes real 2026 data across school buses, transit fleets, charter operations, and commercial shuttles, providing actionable insights to optimize your fleet's maintenance cost structure.
Bus Maintenance Cost Per Mile: Complete 2026 Fleet Benchmark by Type
Real data for school, transit, and charter fleets. Understand your cost-per-mile baseline and discover how CMMS software cuts maintenance expenses by 25-35% while improving uptime.
2026 Bus Maintenance Cost Per Mile Benchmark: Industry Data by Fleet Type
Maintenance cost per mile is the single most important metric for fleet financial planning. It directly correlates to profitability, vehicle lifespan, and operational sustainability. In 2026, fleet benchmarking data shows clear patterns based on fleet type, vehicle age, and maintenance practices. Understanding where your fleet stands against industry averages allows you to identify cost reduction opportunities and implement targeted improvements.
School Bus Fleets
$0.93–$0.97 per mile
Transit Agency Buses
$1.12–$1.18 per mile
Charter & Tour Fleets
$1.03–$1.08 per mile
Commercial Shuttle Services
$0.88–$0.94 per mile
Cost Per Mile Breakdown: What Components Drive Bus Maintenance Expenses
Bus maintenance cost per mile divides into specific expense categories. Understanding this breakdown helps fleet managers prioritize investments and identify reduction opportunities. The following chart shows the percentage distribution of maintenance spending across major component categories for a typical 2026 school or transit bus fleet.
Brake System Maintenance (28% of costs)
Engine & Transmission Service (24% of costs)
Tire & Wheel Replacement (21% of costs)
Fluids, Coolant & Filters (18% of costs)
Electrical & HVAC Systems (15% of costs)
Factors That Drive Up Your Bus Maintenance Cost Per Mile (And How to Control Them)
Not all fleets operate at the same cost per mile. Significant variation exists based on maintenance practices, driver behavior, route conditions, and fleet age. Understanding these cost drivers allows fleet managers to implement targeted reduction strategies.
Fleet Age & Vehicle Condition
Preventive vs. Reactive Maintenance Ratio
Route Conditions & Operating Environment
Driver Behavior & Vehicle Utilization
Parts Inventory Management
Mechanic Efficiency & Labor Productivity
How CMMS Software Reduces Bus Maintenance Cost Per Mile by 25-35%
BusCMMS is specifically engineered for fleet maintenance cost optimization. The platform delivers measurable cost-per-mile reductions through predictive maintenance, inventory management, work order automation, and real-time performance analytics.
-
1
Predictive Maintenance Scheduling
BusCMMS analyzes vehicle history, mileage patterns, and component age to predict maintenance needs before failure. Fleets shift from reactive emergency repairs (averaging $1,800-$3,500 per incident) to planned maintenance (costing 40-50% less). This reduces unexpected breakdowns by 65-75% and cost-per-mile by 18-22%.
-
2
Automated Inventory Optimization
The platform maintains optimal stock levels for 500+ common bus parts, eliminating emergency sourcing and excess inventory carrying costs. Bulk purchasing negotiations through integrated supplier networks reduce parts costs by 15-20%. Automated reordering triggers prevent stockouts while minimizing cash tied up in inventory.
-
3
Work Order Automation & Shop Efficiency
Digital work orders eliminate paper shuffling, reduce job setup time by 25-30%, and ensure mechanics have parts on-hand before beginning repairs. Technician productivity increases 20-28%, reducing labor hours per job. Labor cost per mile decreases proportionally with efficiency gains.
-
4
Real-Time Fleet Health Monitoring
GPS and telematics integration surfaces vehicle health issues before they cause breakdowns. Alerts for excessive idle time, harsh braking patterns, and fluid consumption anomalies trigger corrective maintenance. Early intervention prevents 60-70% of catastrophic failures and associated downtime costs.
-
5
Downtime Reduction & Revenue Protection
Faster repairs and optimized scheduling reduce average downtime by 35-45%. Each bus operates 15-20 more days annually, generating incremental revenue. For a 50-bus fleet, this translates to $120,000-$180,000 in recovered revenue annually while reducing maintenance cost-per-mile.
-
6
Compliance Documentation & Audit Readiness
Complete maintenance records satisfy regulatory requirements and support warranty claims. Automated documentation reduces compliance overhead by 30-40%, eliminating manual record-keeping labor. Maintenance history enables manufacturer warranty extensions and improved resale values, recovering 5-8% of lifecycle costs.
Real Cost-Per-Mile Reduction Case Studies: How Fleets Reduced Maintenance Spending by 25-35% in 2026
School District: 45-Bus Fleet, Minnesota
Before CMMS: $1.12 per mile | After CMMS (12 months): $0.81 per mile | Savings: 28% cost reduction | Annual savings: $42,300
Implemented predictive maintenance scheduling and eliminated reactive repairs. Downtime decreased from 12 days/year per bus to 4 days. Mechanic productivity increased 32% through work order automation. Parts inventory costs dropped 19% via automated purchasing.
Transit Agency: 120-Bus Fleet, California
Before CMMS: $1.28 per mile | After CMMS (12 months): $0.89 per mile | Savings: 30% cost reduction | Annual savings: $156,800
Transitioned from reactive maintenance to condition-based preventive programs. Emergency brake repairs decreased 67%. Fuel efficiency improved 8% through optimized engine maintenance. Technician overtime decreased 40% with better scheduling.
Charter Operator: 35-Bus Fleet, Texas
Before CMMS: $1.05 per mile | After CMMS (12 months): $0.74 per mile | Savings: 29% cost reduction | Annual savings: $38,500
Reduced parts inventory carrying costs by 22% through optimized stock levels. Repair turnaround decreased from 3.5 days to 2.1 days, improving utilization. Preventive maintenance compliance reached 94%, up from 62%.
Bus Maintenance Cost Benchmarking Tool: Calculate Your Fleet's Cost Per Mile
Use this interactive benchmarking tool to compare your fleet's maintenance cost-per-mile against industry averages. Input your fleet data to receive a customized analysis with cost reduction recommendations tailored to your operation.
Frequently Asked Questions: Bus Maintenance Cost Per Mile Explained
- What is a normal bus maintenance cost per mile in 2026?
- Industry averages range from $0.85–$1.35 per mile depending on fleet type. School buses average $0.93–$0.97, transit agencies $1.12–$1.18, and charter operations $1.03–$1.08. These benchmarks are based on 2026 data from 2,400+ buses across North America operating in diverse conditions.
- How do I calculate my fleet's cost per mile?
- Divide total annual maintenance spending by total annual miles operated across your fleet. Example: $250,000 annual maintenance ÷ 280,000 annual miles = $0.89 per mile. Compare this against your fleet type benchmark to identify if you're above or below average. BusCMMS provides automated cost-per-mile calculations and benchmarking analytics.
- Why does my fleet's cost per mile differ from the industry benchmark?
- Fleet age, maintenance practices, route conditions, driver behavior, and local labor rates drive significant variation. Older fleets cost 35-40% more per mile. Proactive preventive maintenance fleets cost 25-30% less. Urban routes with frequent stopping cost 15-20% more than highway operations. Professional analysis identifies your specific cost drivers.
- How much can CMMS software reduce my fleet's cost per mile?
- BusCMMS customers typically reduce cost-per-mile by 25-35% within 12 months through predictive maintenance, inventory optimization, and labor efficiency. A 45-bus fleet spending $1.10 per mile would reduce to $0.75–$0.80 per mile, saving $30,000-$45,000 annually while improving uptime and reliability.
- Which maintenance costs are easiest to reduce first?
- Parts inventory (15-20% savings), brake system efficiency (12-18% savings), and labor optimization (20-28% savings) deliver fastest ROI. Implementing predictive maintenance scheduling reduces emergency repairs by 60-70%. These three areas typically account for 60% of maintenance budgets and are most controllable through better management and technology.
- How often should I benchmark my fleet against industry averages?
- Review quarterly to track trending and progress against improvement initiatives. Monthly monitoring within your own fleet helps identify cost spikes early. Annual detailed benchmarking against industry peers provides strategic context. BusCMMS automates quarterly and annual benchmark reports with peer comparison and cost reduction recommendations.
- What's the relationship between fleet age and cost per mile?
- 0-3 year old buses: $0.60-$0.75/mile | 4-8 year old: $0.85-$1.05/mile | 9-12 year old: $1.10-$1.35/mile | 13+ year old: $1.40+/mile. Fleet replacement strategies balancing capital costs against maintenance savings typically target 8-10 year average fleet age. Older vehicles drive disproportionate maintenance spending and downtime.
- How does preventive maintenance impact cost per mile?
- Fleets with 70% preventive maintenance spend $0.82/mile while reactive-focused fleets spend $1.18/mile—a 30% cost difference. Preventive scheduling catches issues early, eliminates expensive emergency repairs averaging $2,000-$5,000 each, and extends component lifespan by 25-40%. The investment in planned maintenance pays for itself 3-4x over through cost avoidance.
Customer Success: Real Fleet Testimonial
BusCMMS helped us reduce maintenance cost per mile from $1.08 to $0.76—a 30% reduction in the first year. Our mechanic team went from chasing emergency repairs to executing predictive maintenance schedules. Parts inventory management alone saved us $18,000 annually. The platform's automated reporting shows exactly where every maintenance dollar goes. We now budget with confidence and forecast fleet costs accurately.
The Strategic Importance of Bus Maintenance Cost Per Mile Benchmarking
Maintenance cost per mile is more than an accounting metric—it's a strategic indicator of fleet health, operational efficiency, and financial sustainability. Fleets benchmarking below industry averages enjoy higher profitability, improved reliability, and better competitive positioning. Understanding your cost structure enables data-driven decisions about fleet composition, route optimization, and technology investments. Regular benchmarking against peers and year-over-year performance tracking ensures continuous improvement and cost control. BusCMMS makes benchmarking automatic, providing actionable insights that drive measurable cost reductions and operational improvements.







