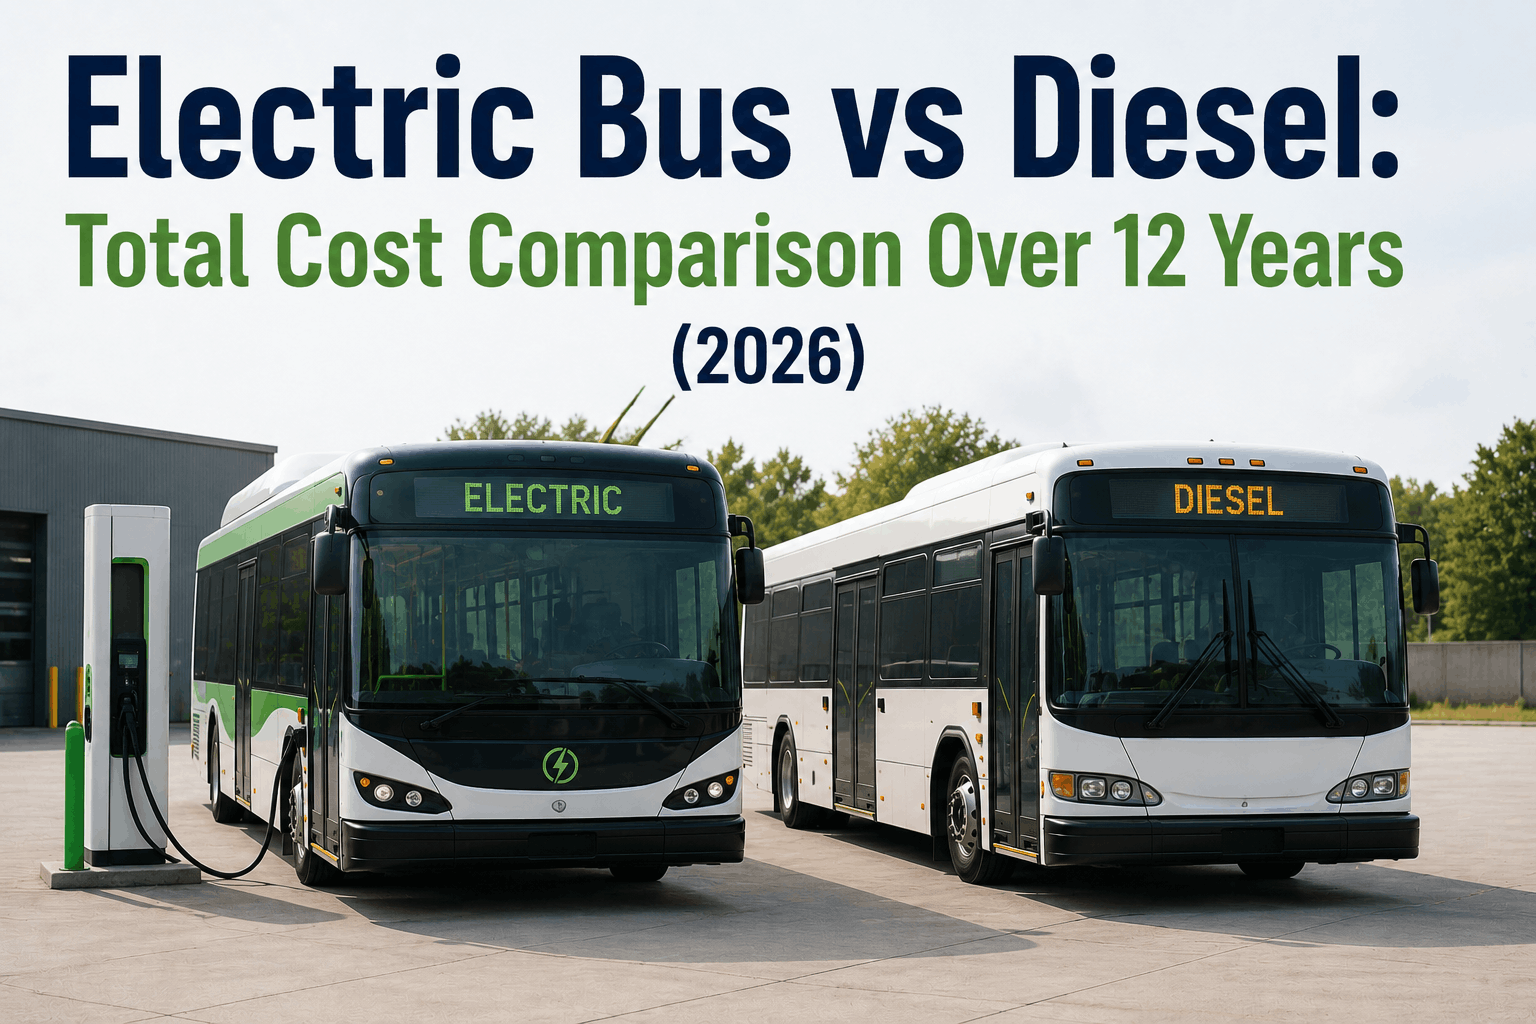
The shift toward electric buses represents one of the most significant fleet transformation decisions fleet managers face in 2026. When evaluating electric vs diesel buses, the immediate sticker shock of electric bus purchase prices—often 40-60% higher than diesel equivalents—obscures the true financial picture. A comprehensive 12-year total cost of ownership (TCO) analysis reveals that electric buses achieve cost parity with diesel buses within 5-7 years and deliver substantial savings over the full lifecycle. This complete cost comparison for 2026 examines purchase prices, fuel costs, maintenance expenses, battery replacement, incentives, and operational savings to help fleet managers make data-driven electrification decisions. Understanding the real economics of electric vs diesel buses is essential for fleet planning, budget justification, and long-term sustainability goals. BusCMMS fleet management software integrates total cost tracking for both electric and diesel fleets, enabling side-by-side financial analysis and ROI calculations.
Electric vs Diesel Bus Costs
Complete 12-year lifecycle cost breakdown with real 2026 pricing, fuel expenses, maintenance data, and battery replacement analysis for electric and diesel fleets.
Purchase Price
12-Year Fuel Cost
Total 12-Year Cost
1
Electric Bus Purchase Price vs Diesel 2026
Initial acquisition cost remains the primary barrier: In 2026, a standard 40-foot diesel transit bus costs approximately $450,000 to $500,000, while comparable electric buses range from $680,000 to $750,000. The price premium reflects battery pack costs, electric drivetrain complexity, and manufacturing maturity differences. Battery packs represent 30-40% of electric bus purchase price. A 300 kWh battery pack costs $20,000-$25,000, and larger 450+ kWh packs for extended range buses push costs higher. However, federal infrastructure subsidies and state electrification grants reduce net costs substantially for US fleet operators.
Federal incentives significantly reduce out-of-pocket costs: The Bipartisan Infrastructure Law (2021) provides $5 billion for electric transit buses through 2026. Transit agencies can receive up to 80% of bus acquisition costs through grants, reducing electric bus net cost to $140,000-$200,000 versus $450,000 full price. Many states offer additional state-level incentives: California's CalEnviroScreen grants, New York's Clean Transportation program, and others reduce costs further. After federal and state incentives, electric buses achieve purchase price parity or cost less than diesel buses in high-incentive regions. Fleet managers should factor incentives into TCO calculations—buses purchased in 2026 often qualify for maximum federal support.
Financing structure impacts net cost: Electric buses typically finance through longer loan periods (10-12 years) matching expected bus lifecycle. Diesel buses often finance over 7-8 years. Extended financing for electric buses spreads costs more favorably, and lease-to-own programs are increasingly available from electric bus manufacturers reducing upfront capital requirements.
2
Fuel Cost Comparison: Diesel vs Electricity Operating Expenses
Electricity costs significantly lower than diesel fuel: A typical 40-foot diesel bus consumes 5.5-6.5 miles per gallon on urban routes. At $3.50 per gallon (2026 average), daily fuel costs are $35-45 per 100 miles traveled. Annual fuel costs for a bus driving 45,000 miles yearly total $15,750-$20,250. Over 12 years, diesel fuel costs accumulate to approximately $420,000 per bus assuming stable pricing. Electric buses consume 1.8-2.2 kilowatt-hours per mile. At $0.14 per kWh (US average electricity cost), operating cost is $0.25-$0.31 per mile or $11-14 per 100 miles. Annual electricity costs for 45,000 miles total $4,125-$5,625. Over 12 years, electricity costs total approximately $147,000 per bus. This represents 65% fuel cost savings compared to diesel. In high-electricity-cost regions (California, New York), savings are 40-50%. In low-electricity regions (Louisiana, Washington), savings reach 75%+.
Fuel volatility risk reduction: Diesel fuel prices fluctuate with global oil markets, creating budget unpredictability. Electric bus operators benefit from historically stable electricity rates and declining renewable energy costs. Fleets reducing diesel dependence reduce exposure to petroleum price volatility—a strategic advantage for 10+ year operating budgets.
Real-world electric bus consumption varies with duty cycle: Highway express routes achieve 2.0+ miles per kWh. Urban stop-and-go routes consume 1.5-1.8 miles per kWh. Cold weather reduces efficiency 15-25%. High-speed routes with frequent acceleration consume more energy than steady-speed routes. Route analysis enables accurate fuel cost projections for specific fleet applications.
3
Maintenance Cost Analysis: Electric vs Diesel Operating Savings
Dramatically reduced maintenance burden drives long-term savings: Diesel buses require extensive scheduled maintenance: oil changes every 15,000 miles, transmission servicing, air filter replacements, fuel system cleaning, exhaust system repairs, and turbocharger maintenance. A typical diesel bus incurs $8,000-$12,000 annual maintenance costs. Electric buses eliminate 80% of this maintenance. No oil changes, no transmission fluid service, no fuel system maintenance, no spark plugs, no exhaust components. Regenerative braking systems reduce brake wear by 90%, extending brake pad life from 100,000 miles to 500,000+ miles. Annual electric bus maintenance costs total $1,200-$1,800 for brake inspection, suspension service, tire maintenance, and electrical system checks. Over 12 years, diesel maintenance totals $144,000 per bus. Electric bus maintenance totals $18,000-$24,000 per bus. This represents $120,000-$126,000 maintenance savings per electric bus over 12 years.
Parts availability and labor costs differ significantly: Diesel bus parts are widely available and inexpensive. Oil, filters, and common components cost $50-200. Electric bus technicians require specialized training; labor rates run 15-25% higher than diesel mechanics. However, fewer service hours required (2-3 hours annually vs 20-30 hours for diesel) more than offset higher labor rates. Overall, electric bus maintenance remains 75% cheaper than diesel.
Predictive maintenance reduces emergency repairs: BusCMMS fleet management tracks electric bus battery health, motor performance, and thermal management systems. Predictive analytics identify degradation patterns before failures occur. Proactive maintenance prevents costly emergency repairs and extends vehicle lifespan, delivering additional cost benefits diesel fleets cannot access.
4
Battery Replacement Costs and Warranty Coverage 2026
Battery replacement is the largest single electric bus cost variable: Battery packs degrade gradually, losing 2-3% capacity annually. After 10-12 years, typical battery capacity declines to 70-85% of original capacity—still sufficient for most fleet operations. Battery replacement becomes necessary when capacity falls below mission requirements, typically around year 10-12. Replacement battery packs cost $80,000-$120,000 installed, representing significant but manageable expense. However, most buses purchased in 2026 operate on manufacturer warranty covering battery degradation through year 8-10. Warranties typically cover battery capacity below 60-70% of original specifications, reducing actual replacement risk during 12-year lifecycle.
Warranty protection minimizes financial risk: Major manufacturers (BYD, New Flyer, Proterra, Gillig) offer 8-12 year battery warranties covering degradation and defects. Warranty extends to fleet operators, not just original purchasers. Buses purchased in 2026 with 10-year battery warranties face potential replacement costs only in years 10-12. Even with replacement, TCO remains favorable compared to diesel because fuel and maintenance savings offset battery replacement. Conservative modeling assumes 50% battery replacement probability in year 10, costing $40,000-$60,000. This single replacement cost remains significantly less than cumulative diesel fuel savings.
Battery recycling and second-life markets emerging: End-of-life battery packs retain 60-80% capacity useful for stationary energy storage, microgrid applications, and backup power systems. Companies like Li-Cycle and Redwood Materials establish battery recycling operations recovering 90%+ of materials. Second-life batteries achieve 10+ year operational life in stationary applications, potentially offsetting replacement costs through salvage value. As markets develop, replacement cost risk decreases further.
5
Total 12-Year Cost of Ownership: Electric vs Diesel Complete Analysis
Complete lifecycle cost accounting shows electric bus economic advantage: A 40-foot diesel bus operating 45,000 miles annually for 12 years incurs: purchase price $450,000 + fuel $420,000 + maintenance $144,000 + registration/insurance $96,000 = $1,110,000 total cost. A comparable electric bus with incentives costs: net purchase $200,000 (after grants) + fuel $147,000 + maintenance $18,000 + registration/insurance $88,000 (typically 8-10% lower than diesel) = $453,000 total cost. Electric bus delivers $657,000 lifecycle savings or 59% cost reduction. Even without incentives, electric bus total cost reaches $982,000 versus $1,110,000 diesel—still providing $128,000 savings.
Break-even analysis demonstrates rapid payback: Electric bus initial cost premium is $245,000 ($745,000 - $500,000 without incentives). Cumulative operational savings (fuel + maintenance) reach $297,000 per year in years 1-12. Break-even occurs in year 8-9, with years 10-12 generating pure profit. Fleets operating buses beyond 12 years extend savings significantly. A diesel bus operating 15 years accrues $1,400,000+ costs. An electric bus operating 15 years costs under $600,000—a $800,000+ advantage demonstrating the economics favor electrification for vehicles with extended operational lifespans.
Financial modeling reveals sensitive variables: Electricity rates significantly impact projections. High-cost regions (California $0.18/kWh) see electric bus fuel costs reach $220,000 over 12 years—still 45% less than diesel. Low-cost regions (Louisiana $0.09/kWh) achieve $95,000 electricity costs—75% savings versus diesel. Maintenance assumptions also vary: conservative models assuming higher electric bus service costs still show $80,000-$100,000 advantages. Diesel fuel price increases improve electric bus ROI; $4.50/gallon diesel creates fuel costs exceeding $630,000 over 12 years, dramatically accelerating electric bus payback.
6
Regional Cost Variations and Incentive Programs 2026
Federal infrastructure subsidies remain robust through 2026: The Bipartisan Infrastructure Law allocates $5 billion for transit bus electrification through 2026. Transit agencies qualify for up to 80% acquisition cost grants through the Federal Transit Administration's Section 5339 program. Large urban transit agencies often receive maximum grants reducing electric bus net cost to $140,000-$180,000. Regional variations exist based on fund availability and agency administrative capacity. Early applicants in 2026 access fuller funding pools; late applicants may face reduced availability. Fleet managers should budget implementation timeline around grant application windows.
State-level incentive programs supplement federal funding: California's Transit and Intercity Rail Capital Program provides additional $200 million annually for bus electrification. New York's Clean Transportation program grants up to $1 million per bus in some cases. Texas, Massachusetts, Illinois, and Washington offer state incentives. Combined federal + state incentives often reduce electric bus net cost below diesel bus price, creating immediate financial justification. Fleet managers should research specific incentive programs available in operational regions and factor maximum available grants into acquisition budgets.
Utility rebate programs support charging infrastructure: Many electric utilities offer rebates for commercial charging installation: $2,000-$10,000 per charger installation, sometimes covering 50% of infrastructure costs. These programs improve charging infrastructure economics, reducing operational barriers to electrification. Coordinating with local utilities during fleet planning captures available rebates.
7
Risk Factors and Sensitivity Analysis for Electric Bus Economics
Battery degradation represents the primary financial risk: Conservative models assume 2-3% annual degradation reaching 70% capacity by year 12. Warranty protection covers degradation beyond normal expectations. Battery replacement probability of 30-50% in years 10-12 costs $40,000-$60,000. Even accounting for replacement costs, total electric bus TCO remains lower than diesel because fuel savings exceed $120,000 and maintenance savings exceed $120,000. Battery replacement is a risk—not a guarantee—and conservative financial models still show electric bus advantage.
Electricity rate escalation affects operational costs: Projections assume stable $0.14/kWh electricity costs. Historical trends show 2-3% annual electricity rate increases. Over 12 years, cumulative rate increases might reach 25-30%, adding $35,000-$50,000 to electricity costs. However, diesel fuel volatility often exceeds electricity rate changes. Diesel price increases directly translate to higher fuel costs without efficiency gains; electricity rate increases occur regardless of fuel type, and electric bus efficiency continues improving. Electric bus fuel cost risk remains lower than diesel in most scenarios.
Infrastructure investment requirements add upfront costs: Depot charging infrastructure installation costs $50,000-$300,000 depending on charger type and quantity. Fast chargers exceed $200,000 installed; opportunity chargers cost $30,000-$50,000 each. Infrastructure is fleet-wide asset benefiting all electric buses, not per-bus cost, but represents significant capital investment. BusCMMS fleet management platforms include infrastructure planning tools helping optimize charger placement, scheduling, and load management to maximize ROI on charging investments.
8
Implementation Strategy: Phased Transition Planning for Fleet Electrification
Phased approach reduces financial and operational risk: Rather than full fleet conversion, successful transitions implement 5-15% fleet electrification initially. Initial electric buses operate on highest-utilization routes generating greatest fuel savings and demonstrating cost advantages. Operational experience with charging, maintenance procedures, and driver training informs full-scale implementation planning. Phased approach spreads capital investment across multiple years, improving cash flow management. Year 1 implementation of 5-10 electric buses costs $3-5 million net (after incentives); year 2 expansion adds 10-15 buses scaling operations with proven processes.
Route selection optimizes initial electric bus deployment: High-utilization urban routes with 120-150 daily miles maximize fuel cost savings. These routes operate on fixed schedules enabling charging during overnight depot layovers. Avoid long-distance express routes exceeding battery range until longer-range buses (600+ mile range) gain market maturity. Local routes generate most predictable energy consumption patterns, enabling accurate financial modeling.
Technology partnerships accelerate transition success: BusCMMS integrates fleet-wide energy management, maintenance tracking, and financial analytics essential for transition success. Real-time fleet data enables rapid identification of operational issues, predictive maintenance scheduling, and optimization of charging patterns reducing electricity costs. Fleet management platforms integrate with charging networks, energy management systems, and maintenance scheduling creating unified operational command center.







