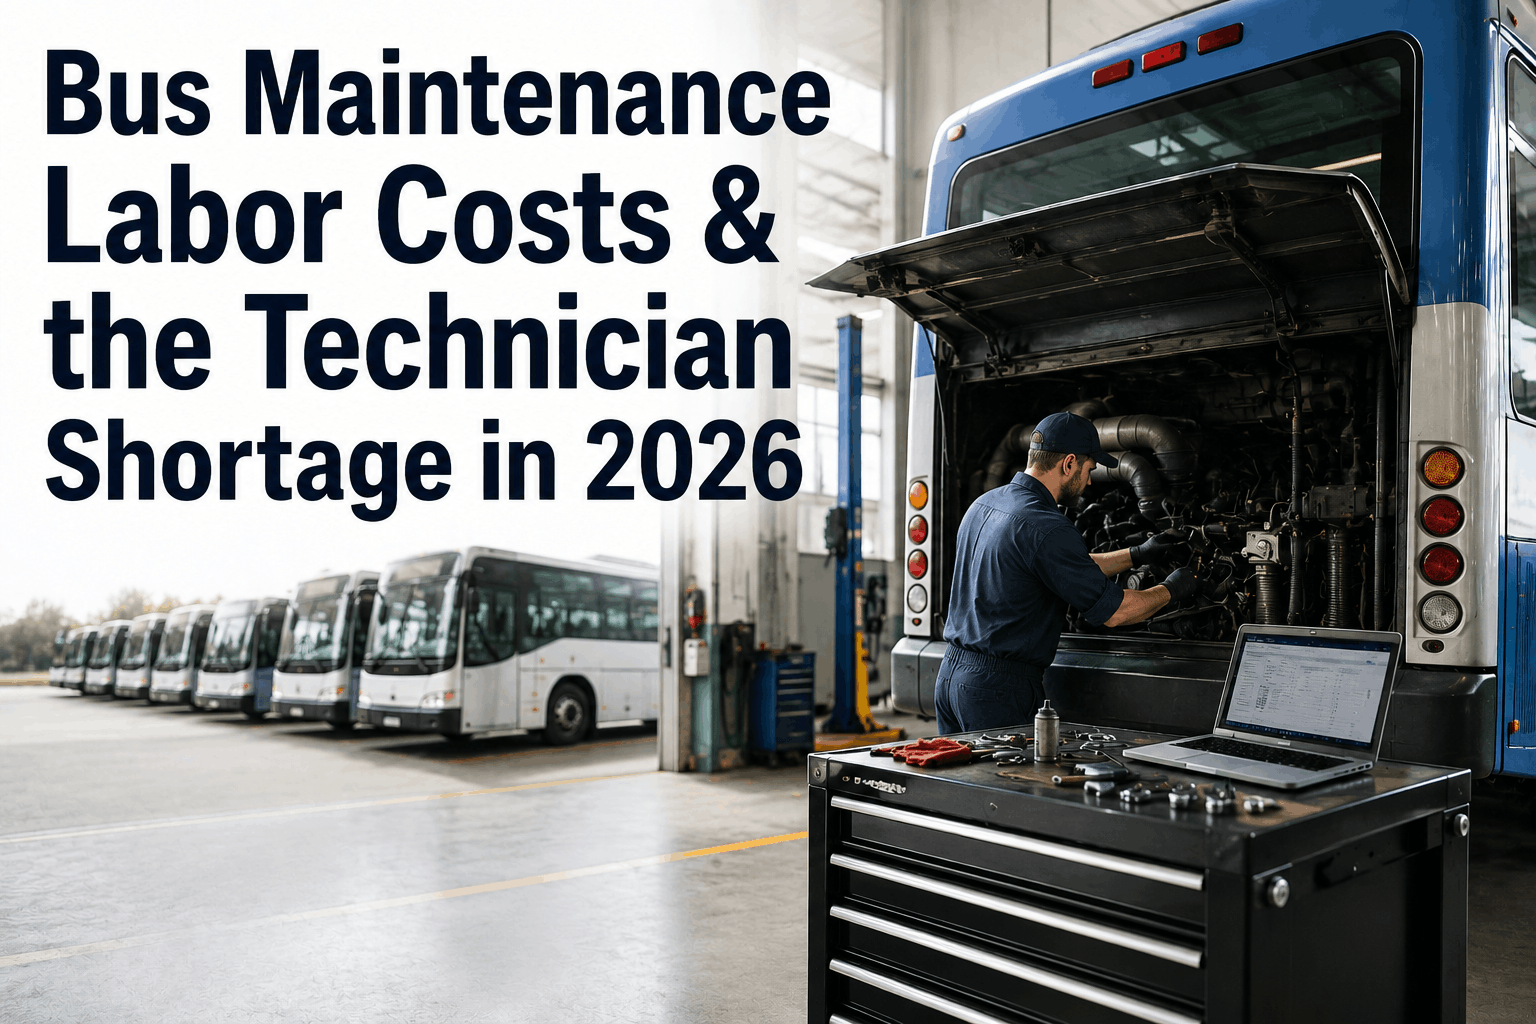
The 2026 technician shortage is reshaping bus fleet economics. Mechanic wages are rising 8-12% annually while availability continues to decline. Labor now represents 25-35% of total maintenance costs—up from 20-25% five years ago. Fleet managers face a critical choice: invest in higher wages to attract talent, implement automation and CMMS to boost productivity, or restructure operations to do more with smaller teams. This comprehensive analysis examines technician wage trends, labor cost drivers, shortage impact on fleet operations, and proven strategies to manage the rising cost of maintenance labor.
2026 Labor Cost Analysis
Bus Maintenance Labor Costs & the Technician Shortage in 2026
Technician shortages are driving mechanic wages up 8-12% annually. Learn 2026 labor costs by role, understand wage trends, and discover how CMMS helps fleets maximize technician productivity with fewer staff.
2026 Bus Technician Wages & Labor Costs by Role
Labor costs for bus fleet maintenance vary significantly by technician role, experience, location, and fleet type. Understanding wage structures helps fleet managers budget accurately, forecast staffing costs, and develop competitive compensation packages that attract and retain talent.
Entry-Level Technician (0-3 years)
$45,000–$55,000 annually
Performs routine maintenance, fluid changes, filter replacements, basic repairs under supervision. Benefits package adds 25-30% to salary cost. Rising demand increases signing bonuses: $2,000-$5,000 common in high-shortage areas. Entry-level technicians represent 30-40% of typical fleet maintenance teams.
Mid-Level Technician (3-7 years)
$55,000–$68,000 annually
Leads complex repairs, brake service, transmission work, electrical diagnostics. Typically ASE-certified or pursuing certification. Shortage-driven wage growth: 10-12% annual increases common. These technicians form the backbone of fleet maintenance operations.
Senior Technician/Lead (7+ years)
$65,000–$80,000 annually
Supervises team, handles specialized repairs, diagnostics, complex systems. Often ASE Master Certified. Critical retention target—replacement costs exceed $50,000. Increasing offers of team lead bonuses and profit-sharing arrangements.
Maintenance Supervisor/Manager
$70,000–$95,000 annually
Oversees all maintenance operations, scheduling, compliance, budgeting, hiring. Increasingly difficult to fill—requires technical expertise plus management skills. Some fleets create dedicated technician lead roles at $55,000-$65,000 to reduce supervisor burden.
Labor Cost as Percentage of Total Maintenance: The Rising Burden
Labor costs are increasing faster than parts and materials, reshaping fleet maintenance economics. The following breakdown shows where labor dollars go and how that's changed since 2020:
Preventive Maintenance Labor (28% of costs in 2026)
Scheduled service labor—routine inspections, oil changes, filter replacements, fluid services. Rising by 10-12% annually as preventive programs expand. Shortage makes it harder to staff routine work teams, pushing more work to overtime.
Corrective Repair Labor (25% of costs in 2026)
Unplanned repair labor for failed components, system failures, emergency breakdowns. Up from 18% in 2020 due to shortage-driven increased downtime and delayed repairs. Overtime rates spike during peak failure seasons.
Diagnostic & Troubleshooting (15% of costs in 2026)
High-skill labor for electrical diagnostics, engine troubleshooting, complex system analysis. Increasing as vehicles age and systems become more complex. Most expensive labor—senior technician rates required.
Why Technician Shortage Drives Labor Costs Up
The diesel technician shortage affecting the entire transportation industry is particularly acute in bus fleet maintenance. Supply-side constraints and demand-side growth create upward wage pressure that shows no signs of easing:
Limited Technician Supply
Technical schools and apprenticeships aren't producing technicians fast enough to replace retirements and attrition. Nationwide shortage estimated at 30,000+ diesel technicians. Bus fleets compete with heavy trucking for scarce talent.
Wage Competition Across Industries
Trucking companies, OEM dealerships, and equipment manufacturers all bid for diesel technicians. Bus fleets often offer lower pay than trucking or manufacturing, losing top candidates to higher bidders.
Experience & Certification Gaps
Bus-specific expertise (brake systems, multiplex electrical) is scarce. Fleets pay premium wages to attract technicians with bus experience, driving salaries up 15-20% above market baseline.
Overtime Multiplier Effect
With too few technicians, work backs up, requiring overtime. OT at 1.5-2x base rates increases per-hour labor cost. A 50-bus fleet with insufficient staff can spend $15,000-$25,000/month on overtime alone.
Retention Costs & Turnover
Turnover costs 50-100% of annual salary (recruitment, training, lost productivity). Fleets in high-shortage regions experience 25-35% annual technician turnover, creating constant replacement cost.
Signing Bonuses & Retention Incentives
Competitive markets require $3,000-$8,000 signing bonuses, stay bonuses, shift differentials, and sign-on pay. These add 5-10% to total labor budget.
Labor Cost Impact by Fleet Type & Size
1
School District Fleets (45-bus example)
Annual labor budget: $1.2M–$1.5M (3-4 full-time mechanics). Rising 10-12% yearly due to wage competition and retention costs. Many districts struggle to fill positions, delaying maintenance and increasing downtime.
2
Transit Agencies (120-bus example)
Annual labor budget: $3.5M–$4.2M (8-10 full-time mechanics + supervisors). 24/7 operations require shift coverage—additional premium labor costs. Technician shortage directly threatens service reliability.
3
Charter Operators (35-bus example)
Annual labor budget: $850K–$1.1M (2-3 full-time mechanics + contract outsourcing). Often more exposed to shortage—smaller size makes it harder to compete on wages and benefits.
4
Large Regional Fleets (200+ buses)
Annual labor budget: $6M–$8M+ (15-20+ technicians). Scale allows competitive compensation, but shortage forces wage leadership. These fleets often set regional wage benchmarks.
How CMMS Increases Technician Productivity & Reduces Labor Costs
When skilled technicians are scarce and expensive, the solution is making each technician more productive. CMMS platforms increase output per technician by 20-35%, allowing fleets to maintain service levels with fewer staff and lower total labor costs:
1
Eliminate Search & Downtime
Digital work orders and automated parts staging cut technician search time by 30-40%. Mechanics spend more time actually working on vehicles. At $50-$65/hour, this saves thousands monthly.
2
Optimize Work Order Sequencing
Schedule jobs to minimize vehicle movement and technician task-switching. Planned, sequential work reduces wasted motion. Technicians complete 20-30% more jobs per shift with better planning.
3
Reduce Rework & Errors
Complete work history and documented maintenance procedures eliminate guesswork. Fewer repeat repairs mean work gets done right the first time, improving technician output efficiency.
4
Shift Work to Less Expensive Resources
Automated routine tasks and clear procedures allow entry-level technicians to handle more jobs, supervised by senior staff. Increases utilization of lower-cost labor resources.
5
Eliminate Overtime Surprises
Predictive maintenance catches issues before they become emergencies. Fewer urgent repairs mean less overtime premium labor cost. Regular preventive scheduling distributes work evenly.
6
Data-Driven Scheduling & Capacity Planning
Historical labor data shows how many technician-hours each job requires. Schedule work accurately to avoid overloading staff and triggering expensive overtime situations.
Proven Labor Cost Reduction Strategies
Strategy 1: Invest in Technician Productivity (ROI: 200-350%)
CMMS platforms, better tools, cleaner work spaces, and organized parts storage let each technician accomplish more. Cost: $15,000-$30,000 annually. Savings: $50,000-$100,000+ in reduced labor hours. Most cost-effective approach when labor is scarce.
Strategy 2: Shift to Predictive Maintenance (ROI: 250-400%)
Data-driven scheduling prevents emergency repairs that spike labor costs. Technicians perform planned work at normal pace instead of rushed emergency repairs at premium rates. Reduces labor costs 15-25%.
Strategy 3: Reduce Technician Turnover (ROI: 300%+)
Turnover costs 50-100% of salary. Investing in retention (better pay, career development, benefits) costs less than constant replacement. Each prevented departure saves $30,000-$60,000.
Strategy 4: Develop Entry-Level Talent Pipeline (ROI: Multi-year)
Partner with technical schools, create apprenticeships, offer training programs. Develop your own technicians rather than competing for scarce talent. Higher retention, lower long-term costs.
The 2026 Labor Cost Outlook
The technician shortage shows no signs of easing. Industry analysts expect continued wage growth of 8-12% annually through 2028. Fleet managers must adapt:
For Small Fleets (25-50 buses):
Can't afford large maintenance staff or high wages. Solution: Heavy investment in CMMS and automation to maximize technician output. Consider contract maintenance for specialized work.
Labor cost increase: 6-10% annually inevitable. Productivity gains from CMMS can offset 50-70% of wage inflation.
For Mid-Size Fleets (50-150 buses):
Must be competitive on compensation while optimizing operations. CMMS is critical—allows fleets to do more with steady workforce rather than constantly hiring.
Labor cost increase: 8-11% annually. CMMS+wage investment strategy maintains competitive talent pool while controlling overall cost growth.
For Large Fleets (150+ buses):
Size is an advantage—can invest in training, development, and competitive pay. Must be wage leaders in market to attract and retain talent.
Labor cost increase: 9-12% annually, but scale allows absorption. Opportunity to train next generation of bus technicians.







