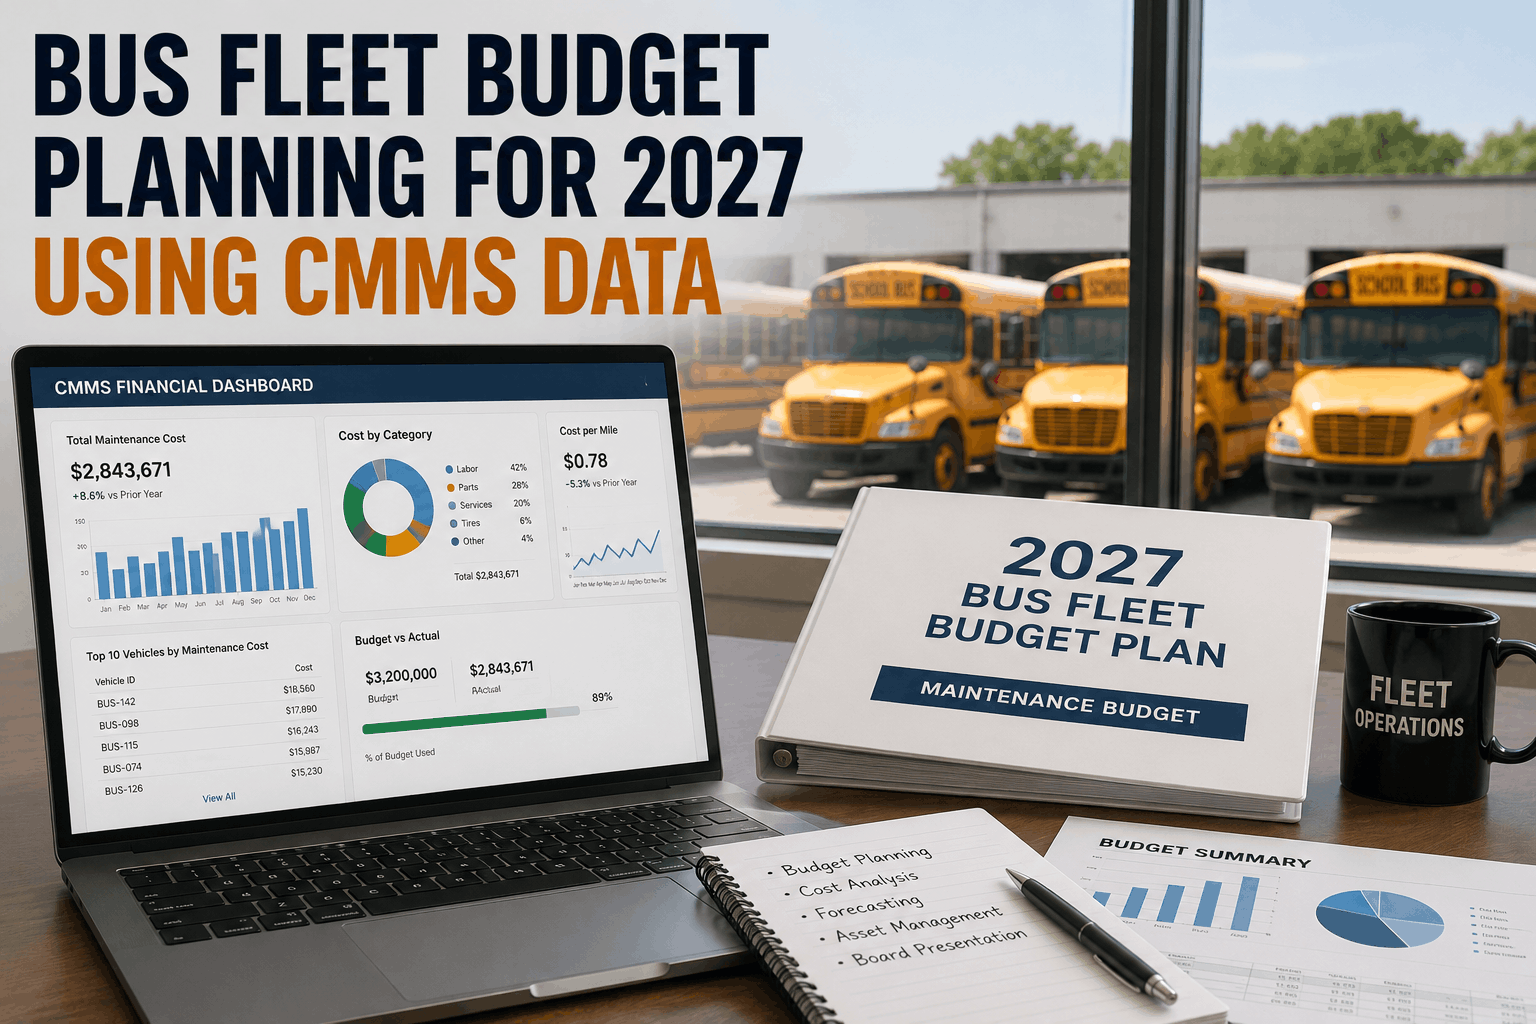
You're presenting your 2027 bus fleet maintenance budget to the board in six weeks. Last year you used broad assumptions — "$X per bus per year" — and the budget got cut 15% mid-year when actual spending diverged from projections. This year you have 12 months of CMMS data showing exactly what you spent, on what, and when. You can build a budget with precision instead of guessing. You can show variance from prior forecasts, identify which vehicle types cost more to maintain, and prove to the board why you need the budget you're asking for. A credible budget built from real data gets approved; a budget built on assumptions gets questioned and cut. This guide breaks down how to extract 2027 budget requirements from 12 months of CMMS data, analyze spending variance, and present the business case to leadership.
Cost Tracking
Bus Fleet Budget Planning for 2027 Using CMMS Data
How to use 12 months of CMMS data to build a credible 2027 bus fleet maintenance budget. Includes variance analysis, vehicle lifecycle cost curves, and the board-level presentation framework that gets budgets approved.
Data Foundation
What Your 12 Months of CMMS Data Should Include
Before you build a 2027 budget, confirm you have 12 complete months of CMMS data from 2026. A complete dataset includes: labor hours logged per work order (with labor rates), parts cost per vehicle per month (aggregated by vehicle and by component type), downtime in hours (vehicles out of service waiting for repairs), maintenance type breakdown (preventive vs. corrective), and vehicle-level metrics (year, model, mileage, hours operated). If you're missing any of these categories, your budget will have gaps.
Most bus fleets implementing CMMS mid-year don't have full 12-month history in their first year. That's okay — use the months you have, then extrapolate. If you have 8 complete months of CMMS data, analyze those 8 months and project to 12 months. Be transparent about the extrapolation in your board presentation: "Months 1–8 represent actual tracked data; months 9–12 are projected based on seasonal variance patterns from months 1–8." Transparency builds credibility.
CMMS Data Completeness Checklist
Labor hours tracked per work order
✓
Labor rates documented (hourly cost)
✓
Parts and materials cost per repair
✓
Vehicle ID linked to all work orders
✓
Downtime tracked (hours out of service)
✓
Preventive vs. corrective maintenance split
✓
Vehicle age, model, mileage/hours tracked
✓
12 complete months of data (or documented partial period)
✓
Budget Analysis
Four Core Metrics to Extract from CMMS Data
Once you have 12 months of CMMS data, extract four core metrics that will form the backbone of your 2027 budget:
1
Cost Per Bus Per Year (CPBY)
Total Maintenance Cost ÷ Number of Buses ÷ Number of Years
If you spent $450,000 maintaining 100 buses in 2026, your CPBY is $4,500. This is your baseline metric. In 2027, assume similar CPBY unless you have vehicles aging significantly (older buses cost more) or retiring (reducing fleet size).
2
Vehicle Lifecycle Cost Curve
Cost Per Bus by Age (Year 1 vs. Year 10)
Don't assume all buses cost the same to maintain. A bus in Year 1 of service (typically under warranty) costs far less than a bus in Year 10 (major repairs, replacement components). Extract cost data by vehicle age and plot the curve: Year 1 might be $2,500/bus; Year 5 might be $5,000/bus; Year 10 might be $8,000+/bus. This curve predicts 2027 costs based on your fleet's age distribution.
3
Preventive vs. Corrective Maintenance Split
(Preventive Cost ÷ Total Cost) × 100
If 60% of your spending is preventive (scheduled PMs) and 40% is corrective (emergency repairs), that's a healthy ratio. If it's 30% preventive and 70% corrective, your fleet is under-maintained and costs will spike as aging systems fail. Use this ratio to justify why increasing preventive maintenance budget now reduces total spend later.
4
Seasonal Variance Pattern
Month-to-Month Cost Distribution
Maintenance spending isn't flat across months. School buses spike in August (back-to-school prep). Transit buses may spike in winter (brake, heating system failures). Extract your monthly pattern: does September cost 15% of annual? March cost 12%? Use this pattern to forecast monthly spend in 2027 and justify why Q1 budgets might be higher than Q2.
Variance Analysis
Explaining Why Your 2027 Budget Differs From 2026
When you present your 2027 budget to the board, they'll compare it to 2026 actual spending. If 2027 is 10% higher, you need to explain why. A credible variance analysis shows that your budget increase is driven by predictable factors, not wishful thinking.
Budget Variance Drivers
Fleet Aging Impact
If your average bus age increased from 5.2 years to 5.8 years between 2026 and 2027, maintenance costs will rise. Use your lifecycle cost curve: each additional year of age adds ~$400/bus/year in maintenance. With 100 buses, that's $40,000 additional budget.
Vehicle Retirements & New Purchases
If you retired 5 old buses (Year 10, high-cost) and purchased 5 new buses (Year 1, low-cost), your average CPBY will decrease. Calculate: old buses averaged $8,000/year each; new buses average $2,500/year. Savings: (5 × $8,000) − (5 × $2,500) = $27,500 reduction.
One-Time 2026 Events
Did you replace an engine in a bus in 2026? Replace HVAC systems? These are one-time capital events. Exclude them from 2027 projections unless you expect similar events. Document: "2026 included $60K in engine replacement (non-recurring); 2027 budget does not repeat this."
Corrective vs. Preventive Shift
If you're increasing preventive maintenance (which costs less long-term but costs more short-term), explain: "Increasing PM budget by $40K reduces corrective maintenance by $60K by year-end, net savings $20K. Upfront investment of $40K is offset by $60K reduction in emergency repairs."
Parts & Labor Cost Inflation
Bus parts and labor costs typically inflate 3–5% annually. If 2026 average labor rate was $65/hour, 2027 might be $67–$68/hour. Document: "Labor inflation of 3% + parts inflation of 4% = blended inflation of 3.5% on maintenance costs." With $450K 2026 spend, 3.5% inflation = $15,750 additional budget.
Mileage or Operating Hours Increase
If your fleet ran 2.1M miles in 2026 and will run 2.3M miles in 2027, maintenance scales with usage. Calculate cost per mile: $450K ÷ 2.1M = $0.214/mile. For 2.3M miles: $0.214 × 2.3M = $492,200 projected maintenance cost.
Building the Budget
Step-by-Step Framework for 2027 Projection
Use this framework to build your 2027 budget from 2026 CMMS data:
Step 1
Calculate 2026 Baseline CPBY
Take 12 months of 2026 CMMS data. Sum all labor, parts, and materials costs. Divide by number of buses in fleet.
Example: $450,000 ÷ 100 buses = $4,500/bus/year
Step 2
Adjust for Fleet Composition
Adjust for aging or new vehicles. Extract lifecycle cost curve from CMMS data and apply aging impact.
Example: Fleet ages 5.2→5.8 years × $400/year = +$240 adjustment
Step 3
Apply Cost Inflation Factors
Research 2027 inflation for bus parts and labor (typically 3–5%). Apply blended inflation to adjusted CPBY.
Example: $4,740 × 1.035 (3.5% inflation) = $4,906 CPBY
Step 4
Adjust for Operating Hours/Mileage
Calculate cost per mile/hour from 2026 data, then multiply by 2027 projected usage.
Example: $0.214/mile × 2.3M miles = $492,200 projected
Step 5
Account for Strategic Maintenance
Show preventive vs. corrective trade-off. Increasing PM budget reduces emergency repair costs.
Example: +$40K PM − $60K corrective = −$20K net savings
Step 6
Project Monthly Distribution
Use 2026 seasonal variance pattern to distribute 2027 budget across months.
Example: $492,200 × 12% (September %) = $59,064
Step 7
Add Contingency Buffer
Add 5–10% contingency for unexpected major repairs. This is risk management, not padding.
Example: $492,200 × 1.07 = $526,554 final request
Board Presentation
The Framework That Gets Budgets Approved
Budget approval depends less on the number itself and more on credibility. Board members ask three questions: (1) Is this based on real data or assumptions? (2) Can you explain the variance from last year? (3) What happens if we cut this budget? A presentation that answers all three gets approved.
1
Opening: The 2026 Baseline
"In 2026, we maintained a 100-bus fleet with 12 months of complete CMMS tracking. Total maintenance cost: $450,000. Cost per bus per year: $4,500. This data comes from our computerized maintenance management system — every labor hour, every part, every repair is tracked."
2
Context: Fleet Composition & Operating Conditions
"Our 2027 fleet averages 5.8 years old (up from 5.2 years in 2026). We're retiring 5 buses (Year 10, high-cost) and adding 5 new buses (Year 1, low-cost). We're also increasing service hours 10% — more routes, more revenue, but more wear on the fleet."
3
Variance Explanation: Why Our 2027 Budget is $527K (vs. $450K in 2026)
"The $77K increase (17%) breaks down as follows: Fleet aging $40K, operating hours increase $30K, cost inflation 3.5% ($15.8K), less savings from retiring old buses ($15K) = net $70.8K increase. Plus 7% contingency ($36K) for unexpected major repairs. Total 2027 request: $527K."
4
Trade-off Analysis: What We're Increasing & Why
"We're increasing preventive maintenance budget by $40K because our CMMS data shows we're under-maintaining (only 35% of spend is preventive vs. best practice 60%). This shift reduces emergency repairs by $60K, net savings $20K by year-end. Upfront investment now prevents failures later."
5
Downside Scenario: What Happens If We Cut This Budget
"If we cut to $450K (matching 2026), we'd underfund fleet aging and increased usage. This forces us back to reactive maintenance — more emergency breakdowns, more downtime, more service disruptions. Our CMMS data shows each emergency repair costs 40% more than a planned PM. Cutting preventive budget now costs us $2–3 later in repairs."
6
Closing: Commitment to Accountability
"We'll track 2027 spending in our CMMS monthly and report actual vs. budget to this board quarterly. If we're tracking under budget, we'll identify savings. If we're exceeding, we'll explain why early. Transparency and real data drive this budget request."
Key Metrics Dashboard
What to Track Monthly for 2027 Budget Accountability
Once your 2027 budget is approved, track these metrics monthly to stay on track and demonstrate accountability:
Cost Per Bus Per Month
Monthly maintenance cost ÷ active buses. Track against monthly budget.
Budget $43,917/month ($527K ÷ 12). If October actual is $48,000, flag variance.
Preventive vs. Corrective Ratio
% of budget spent on preventive PM vs. emergency repairs.
Target 60% preventive, 40% corrective. If trending 45/55, increase PM scheduling.
Downtime Hours Per Bus
Total hours vehicles are out of service waiting for repairs.
Increasing downtime signals maintenance backlog or parts delays. Red flag for budget pressure.
PM Completion Rate
% of scheduled PMs completed on schedule.
Target 95%+. Below 90% means PM backlog — corrective costs will spike in 2–3 months.
Parts Cost Inflation Tracking
Average cost of common repairs month-to-month.
If brake pad costs or labor rates exceed 3.5% inflation assumption, note for 2028 budget.
Budget Variance by Vehicle Age
Cost per bus for Year 5 vehicles vs. Year 8 vehicles.
If Year 8+ buses exceed lifecycle cost projections, fleet is aging faster than expected.
Data-Driven Budgets Get Approved
The difference between a budget that gets cut and a budget that gets approved is credibility. A budget built from 12 months of CMMS data, analyzed for variance, and presented with clear justification for increases wins approval. A budget built on assumptions gets questioned, cut, and typically ends up over-budget by year-end. Start now building your 2027 budget from 2026 CMMS data. Extract your four core metrics (CPBY, lifecycle cost curve, PM ratio, seasonal variance), analyze variance drivers, and project 2027 requirements with precision. When you present to the board, you'll have data instead of guesses. Schedule a budget analytics demo to see how CMMS data transforms budget planning.
Budget Planning FAQs
We don't have 12 months of CMMS data yet. Can we still build a credible 2027 budget?
Yes, but be transparent about it. If you have 8 months of data, analyze those 8 months and extrapolate to 12. In your board presentation, clearly state: "Months 1–8 represent actual tracked data; months 9–12 are projected based on seasonal patterns in months 1–8." This is more credible than guessing, and you can refine the projection as you collect more months of actual data.
How do I justify a budget increase to the board when they want to hold spending flat?
Show variance analysis. Break down the increase into components: fleet aging ($40K), operating hours increase ($30K), cost inflation ($15.8K), less savings from retirements ($15K) = $70.8K drivers. Then show the trade-off: "Increasing preventive maintenance by $40K reduces emergency repairs by $60K, net $20K savings." Data-driven justification beats negotiation.
What if our actual 2026 spending was all over the map? How do I build a budget from volatile data?
Volatility is real, so account for it. Instead of assuming 2027 equals 2026 CPBY, use the highest spending month in 2026 as a lower bound, and the average as a middle estimate. Add a 7–10% contingency to account for outlier months. Volatility can be explained by one-time events (major repairs) or poor preventive maintenance — identifying the cause helps project 2027 more accurately.
Should we budget higher for preventive maintenance even if it increases short-term costs?
Yes, if your CMMS data shows you're under-maintaining. If corrective spending is 70%+ of your budget (vs. 40% best practice), you're paying more long-term for reactive repairs. Increase preventive budget now, explain the trade-off to the board (more PM spending upfront, but lower total spending in 6–12 months), and track the savings to prove the ROI.
How do I account for the fact that older buses will fail unpredictably and spike costs?
Use your vehicle lifecycle cost curve from CMMS data. Older buses (Year 8+) have a higher baseline cost AND higher variance (more unpredictable failures). Budget for the higher baseline, then add a contingency percentage (5–10%) specifically for unexpected major repairs on aging vehicles. This is transparent and justified by data.
What if our fleet size is changing in 2027? How does that affect the budget?
Calculate CPBY (cost per bus per year) instead of total cost. If 2026 was $4,500/bus with 100 buses ($450K total), and 2027 has 110 buses, multiply $4,500 × 110 = $495K. Adjust CPBY for aging (if fleet averages older) or new vehicles (if adding young buses). The CPBY approach scales automatically when fleet size changes.
How do I present budget variance in a way that doesn't make it look like I miscalculated last year?
Frame it as learning and refinement, not error. "In 2026, we budgeted $X based on historical estimates. With a full year of CMMS data, we now understand the true cost drivers: aging fleet (+$40K), operating hours (+$30K), inflation (+$15.8K). Our 2027 budget is more accurate because it's based on real data, not estimates." This positions you as data-driven and committed to improving forecasts.
Should contingency buffer be added to the budget or hidden in the ask?
Be transparent. State your base budget ($490K calculated from data) and add visible contingency (+7% = $34K) separately. Total ask: $524K. The board respects transparency and understands that maintenance forecasts have inherent uncertainty. Hidden buffers look like padding; transparent contingency looks like risk management.
How often should we update the 2027 budget during the year if actual spending diverges?
Monitor monthly and communicate quarterly to leadership. If you're tracking 10% under budget by June, flag it early — you can either reduce spending, extend PMs, or redirect savings. If you're tracking 10% over by June, identify why (unexpected major repairs?) and request an adjustment before it becomes a year-end crisis. Transparency prevents budget surprises.







