A maintenance log is the record of what work has been performed on a bus, when it was performed, and what parts were used. This historical record is essential for troubleshooting, warranty claims, compliance documentation, and making decisions about bus replacement. Without a maintenance log, you have no way to answer critical questions: What work has been done on this bus? How much have we spent maintaining it? When was the last time the transmission was serviced? Has this component been repaired or replaced before? Is this failure covered under warranty? A proper maintenance log captures every service performed, creating a permanent record for the bus's entire service life. Many fleets use paper work orders or informal spreadsheets to track maintenance. These approaches lose information—paper gets filed away and becomes impossible to search, spreadsheets become disorganized and incomplete. A systematic maintenance log ensures information is captured consistently, stored securely, and accessible when needed. A good maintenance log template includes: date of service, mileage at service, description of work performed, parts replaced, labor hours, cost, technician name, and next scheduled service. This guide provides a free template and instructions for implementing maintenance logging in your fleet.
Maintenance Reporting Template — Proven with 200+ School Districts & Transit Agencies
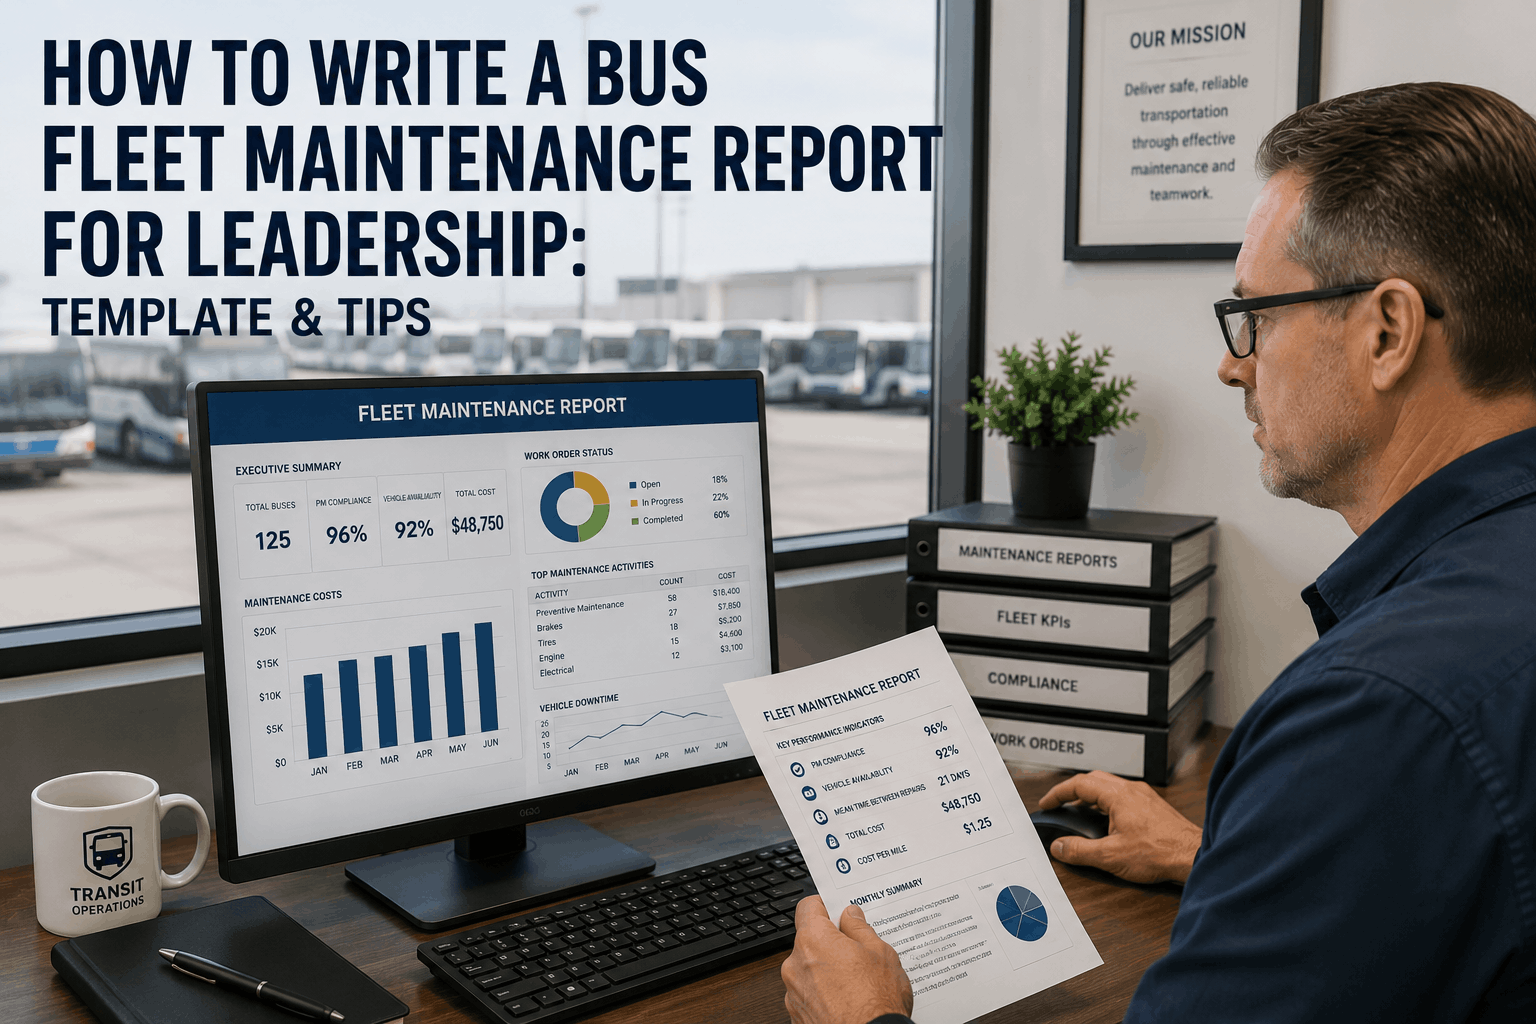
How to Write a Bus Fleet Maintenance Report for Leadership: Template & Tips
Create executive-ready maintenance reports in 30-45 minutes using this proven template. Includes report sections, KPI dashboards, budget justification talking points, and direct integration with BusCMMS data export.
Why Maintenance Reports Matter: The Communication Challenge
Maintenance leaders and fleet managers live in a data-rich world: every work order, parts transaction, technician hour, and vehicle metric is recorded in the CMMS. Yet when asked to report fleet status to the board or budget committee, they often struggle to translate operational data into a narrative that non-technical leadership understands. A maintenance director might say "we achieved 87% PM compliance and reduced unplanned downtime by 12%." A board member hears numbers with no context and no sense of whether 87% is good or whether 12% is significant. The translation gap exists because maintenance reporting has historically been either: (1) a wall of data and technical jargon, or (2) an oversimplification that leaves leadership wondering if they are getting the full picture.
The most effective maintenance reports bridge this gap by: translating technical metrics into business impact (PM compliance improves parts availability, which reduces downtime, which keeps buses in service and reduces late routes), using visual formats that show trends over time (charts are processed faster by the brain than tables of numbers), telling a story with data (fleet condition is improving due to systematic preventive maintenance, or fleet condition is deteriorating and requires capital investment), and providing specific asking points (if you want to reduce downtime further, we need to upgrade predictive maintenance tools). BusCMMS Maintenance Analytics generates most of the data needed for these reports automatically, so the fleet manager's job shifts from data collection to data interpretation and narrative.
Standard Maintenance Report Structure (12-Section Template)
Executive Summary (1 page)
One-page overview of fleet health, key metrics, and any critical issues requiring immediate attention. Format: 3-4 KPI cards showing fleet status (green/yellow/red), 2-3 major initiatives from this period, and forward-looking statement (fleet health stable, improving, or at risk). Audience: board members and executive team who may not read the full report.
Fleet Health Scorecard (1 page)
Visual dashboard showing current status of: preventive maintenance compliance %, average age of fleet, unplanned downtime per bus per month, fuel efficiency trend, safety incident rate, and warranty claim recovery rate. Include 12-month trend line for each metric showing improvement, decline, or stability. This section gives leadership a complete picture of fleet condition in one visual.
Preventive Maintenance Analysis (2 pages)
PM compliance percentage by vehicle type (school bus, transit, paratransit), compliance trend over time, any PM services delayed beyond schedule (with reason), and impact of PM on downtime. Include a table showing which PM services have highest completion rates (brake service at 95% compliance) and which are most often delayed (transmission service at 78% compliance). Frame as: "Preventive maintenance compliance improved from 82% to 87% this period, reducing unplanned failures by 12%."
Downtime and Availability Metrics (1-2 pages)
Total fleet downtime hours this period, downtime per bus per month, primary causes of downtime (brake service, engine work, transmission, electrical, etc.), and comparison to prior period. Calculate availability percentage: (total possible service hours - downtime hours) / total possible hours. Include a pie chart showing downtime by cause so leadership can see where the problem areas are. Frame as: "Fleet availability improved to 94.2% from 91.8% through earlier brake maintenance scheduling."
Parts Inventory and Procurement (1 page)
Inventory value, inventory turnover rate (how quickly parts are used after purchase), parts on hand vs parts on order, and stock-out events (times parts were needed but unavailable, forcing emergency ordering). Include vendor performance summary: which vendors had highest fill rates and on-time delivery. Frame as: "Improved parts inventory management reduced emergency ordering by 40%, saving $12,000 in rush charges."
Maintenance Spending Analysis (2 pages)
Total maintenance spending for period, spending per bus, spending by category (labor, parts, subcontracted services), spending trend over 12 months. Compare to budget: are you over/under budget and by how much? Show year-over-year comparison: is spending increasing (fleet aging) or decreasing (efficiency improvements)? Include break-even analysis: if fleet has $2.2M annual maintenance budget and prevents one serious accident (cost $250K+), the maintenance program ROI is >10x. This section justifies budget requests to leadership.
Safety Metrics and Incidents (1 page)
Safety incident rate (accidents per million miles or per 100 buses), trends over time, any serious incidents and status of corrective actions, driver safety coaching program outcomes if applicable. Include any DOT violations or audit findings and remediation status. Frame as: "No serious incidents this period; minor accident rate declined 8% through enhanced preventive brake maintenance and driver coaching."
Warranty Claim Status (1 page)
Total warranty claims submitted, total warranty claim value recovered, claim approval rate (% of claims the OEM approved vs denied), and claim processing time. Show claims by vehicle model and component: which buses have the most issues (signals potential design/assembly problem) and which parts fail most (signals parts source quality issue). Frame as: "Recovered $87,000 in warranty claims this quarter by improving claim documentation and submitting within warranty windows."
Technician Productivity and Training (1 page)
Hours worked vs billable hours (measure of technician utilization), work orders completed per technician per week, average work order completion time (trend over time to see if getting faster or slower), and training hours per technician. Include technician turnover rate and any retention initiatives. Frame as: "Technician productivity improved 6% this period; staff retention at 92% compared to 78% industry average for fleet maintenance roles."
Capital Planning and Fleet Age (1 page)
Fleet average age by vehicle type, recommended replacement timeline based on age and condition, projected capital needs for next 3-5 years, and lifecycle cost analysis (total cost to keep a bus vs cost to replace). If fleet is aging (average age increasing), frame this as a funding priority for replacement capital. If fleet is young, frame as: "Current fleet composition supports low maintenance costs for next 2-3 years."
Initiatives and Improvements (1-2 pages)
Highlight 2-3 major initiatives completed or in progress: AI predictive maintenance implementation, new parts inventory system, driver safety coaching program, digital inspection rollout, etc. For each initiative, show before/after metrics: predictive brake maintenance reduced emergency brake service calls from 4/month to 1/month, saving $8,000 quarterly. This section demonstrates continuous improvement and ROI on system investments.
Forward-Looking Priorities (1 page)
Maintenance goals and initiatives for next quarter/year: implement predictive maintenance on 20 more buses, reduce parts inventory 15% through better forecasting, train all technicians on new diagnostic equipment. Include resource requests: if you want to reduce downtime by an additional 8%, we need to implement telematics-based monitoring ($45,000 investment, 2-year ROI). This section is your asks section: frame it as business case with clear ROI.
Sample Talking Points for Each Report Section
PM Compliance Success
Our PM compliance rate of 87% (up from 82% last period) means that 87% of scheduled maintenance is completed on schedule. This prevents surprise failures during operation. The 12% downtime reduction we achieved this period is directly attributable to higher PM compliance — buses are better maintained before failures occur.
Downtime Reduction
Fleet availability improved to 94.2% through proactive maintenance scheduling. This means 94.2% of buses are available for service on any given day. Every 1% improvement in availability translates to approximately 200-300 additional service hours available per month, enabling more routes and better on-time performance.
Budget Justification
Our maintenance budget represents 4.2% of total fleet operational cost. Industry benchmark for well-maintained fleets is 4-5%. Our preventive maintenance focus prevents the alternative: reactive maintenance costs 2-3x as much because emergency repairs occur at inconvenient times, require overtime labor, and often force fleet downtime during peak service periods.
Safety Performance
Zero serious incidents this period and accident rate declined 8%. This is not luck — it is the result of systematic preventive maintenance on safety-critical systems (brakes, tires, steering) and driver coaching on safety behaviors. A single serious accident costs $250,000+ in liability. Our preventive program prevents that.
Warranty Recovery
We recovered $87,000 in warranty claims this quarter by documenting defects correctly and submitting claims within OEM warranty windows. This is 4% of our maintenance budget recovered directly from manufacturers. Without systematic warranty management, this money would be absorbed as fleet cost.
Technician Retention
Our technician retention rate of 92% vs 78% industry average is a competitive advantage. Experienced technicians maintain better quality work, complete repairs faster, and train newer staff effectively. This retention rate is directly enabled by systematic CMMS processes that reduce technician frustration from disorganized work and unclear priorities.
Generate Executive Reports Automatically
BusCMMS auto-exports maintenance data formatted for this 12-section template. Maintenance Analytics pre-calculates all KPIs. Turn raw data into a board-ready report in 30 minutes. Proven template used by 200+ districts and transit agencies.
Best Practices for Maintenance Report Presentation
Lead with Business Impact, Not Technical Data
Board members care about: are buses available when needed, are students/passengers safe, is budget being managed responsibly. Lead report sections with business framing: "Fleet availability improved to 94.2%, enabling 312 additional service hours this month." Then provide technical details for those who want to drill deeper.
Use Visual Formats Over Tables
A line chart showing 12-month downtime trend is processed faster by the brain than a table of monthly downtime numbers. Use bar charts for comparisons (this period vs last period), pie charts for composition (downtime by cause), and line charts for trends (compliance improving or declining over time).
Show Trends, Not Snapshots
A single month's data point (PM compliance 87%) is interesting. A 12-month trend showing improvement from 82% to 87% is compelling. Trends demonstrate whether programs are working and moving in the right direction. They also set the baseline for future performance goals.
Include Forward-Looking Asks
Do not end reports with only backward-looking data. End with: "To achieve our next improvement goal (reduce downtime to 5.2%), we need to implement predictive maintenance on 40 more buses at a cost of $180,000. Expected ROI is 18 months through emergency repair cost avoidance." This frames the maintenance program as forward-moving and investment-focused.
Benchmark Against Industry Standards
A PM compliance rate of 87% means little without context. Industry benchmark is 80-90% for well-maintained fleets, 60-75% for average fleets. Include one sentence: "Our PM compliance of 87% places us in the top quartile of U.S. bus fleets." This contextualizes your performance.
Tell a Story with Data
The best reports tell a coherent narrative: "This period we focused on brake system preventive maintenance. Result: brake-related downtime declined from 2.1% to 1.4%. This enabled a 12% reduction in overall downtime. Going forward, we are extending the same proactive approach to transmission maintenance." This weaves individual metrics into a strategy.
Monthly vs Quarterly vs Annual Report Focus
Monthly Report (5-8 pages)
Focus on operational metrics: downtime, work orders completed, parts spend, and any critical issues. Monthly reports are for operational audience (fleet management, maintenance supervisor, transportation director). Include trends but recognize that 1-month trends are noisy. Frame as: current status and trajectory.
Quarterly Report (12-16 pages)
Include full 12-section template. Present to leadership and board committees. Include trend analysis (3-month trends are more statistically meaningful than 1-month). Focus on: PM compliance, downtime reduction, cost per mile, safety, and major initiatives completed. This is the "how are we performing" report.
Annual Report (16-20 pages)
Include full 12-section template plus year-over-year comparisons and 3-5 year trend analysis. Include comprehensive financial analysis (total spend vs budget variance, cost per mile trends over 5 years). Present to board of education or transit board. Include forward-looking capital plan: fleet age, replacement needs, and multi-year budget implications.
I was spending 8-10 hours compiling maintenance data from spreadsheets for monthly reports to the superintendent. With this template and BusCMMS, I generate the same report in 30 minutes. More importantly, the reports now tell a clear story about fleet performance that the superintendent actually reads and understands. Last budget cycle, we justified a new maintenance facility based on data from these reports. The template made the business case clear.
FAQ: Maintenance Reporting Best Practices
How often should I generate maintenance reports?
Monthly operational reports for management, quarterly reports for leadership/board, annual comprehensive reports for budgeting and strategic planning. Monthly reports take 30-45 minutes using this template and BusCMMS data export.
What data should I include in executive summaries?
5-7 critical KPIs only: fleet availability %, PM compliance %, downtime (hours/bus/month), spend per mile, safety incident rate, warranty recovery %, and any alerts (aging fleet, budget overrun). Limit to one page.
How do I justify maintenance budget increases to the board?
Show 3-year cost trend and correlate to fleet age. Include ROI calculation: preventing one serious accident (cost $250K+) pays for 5 years of proactive maintenance spending. Compare your cost-per-mile to industry benchmarks to show competitive positioning.
Should I include all 12 sections in every report?
Monthly reports: 6-8 key sections (downtime, spending, PM compliance, safety, initiatives). Quarterly reports: full 12 sections. Annual reports: full 12 sections plus multi-year analysis and capital planning. Tailor depth to audience.
What format works best for board presentations?
Executive summary (1 page with 6-7 KPI cards), 2-3 supporting detail pages with charts and trend lines, and 1 forward-looking page with asks/priorities. Present from this summary; provide full report as backup for deep-dive questions.
How do I handle poor performance metrics in reports?
Transparency is essential. Include the problem metric (PM compliance declined from 87% to 82%), explain root cause (technician turnover, equipment downtime), and present recovery plan (hiring 2 new technicians, expected recovery in 60 days). Leadership respects honesty and action plans more than hiding bad numbers.
Can I automate report generation entirely?
BusCMMS can auto-generate 70-80% of this template: KPI cards, charts, trend lines, spending analysis, PM compliance. You add 20-30% context: brief narrative, talking points, forward-looking section. This 30-minute review step ensures report quality and relevance.
How do I present complex technical issues to non-technical boards?
Translate to business impact. Instead of "engine OBD II code P0455," say "fuel system issue detected on 3 buses, reducing availability 4.2%, repair scheduled this month." Board cares about impact and resolution timeline, not technical codes.
Conclusion: Data-Driven Fleet Leadership
The most effective bus fleet maintenance programs are data-driven: decisions are made based on evidence, performance is measured against standards, and improvements are tracked over time. This 12-section maintenance report template provides the framework to translate transaction-level CMMS data into a coherent narrative that leadership, boards, and budget committees understand and respond to. The template works because it balances technical rigor with business clarity: every metric has context, every trend has interpretation, and every section has an implicit or explicit ask that moves the fleet maintenance program forward. Start your free BusCMMS trial to access automated report generation and Maintenance Analytics that populate this template automatically. Or schedule a demo to see the report generation workflow and learn how to customize this template for your district or agency.







