A 58-bus Illinois school district spent $14,200 on emergency parts orders in a single school year — not because their vendors were unreliable, not because the parts were exotic, and not because they lacked budget. They spent it because their minimum stock levels were wrong. Air filters set to a minimum of 2 on a fleet that consumed 4 per week during back-to-school surge. Brake chambers stocked at 1 unit on a part with a 9-business-day lead time. Tie rod ends stocked at zero because "we've never needed two in the same month" — until they did, during a week when their primary supplier was backordered on the exact OEM part number. Emergency freight premiums on those orders ran 3–5 times standard shipping. Technicians waited. Buses sat. Routes were covered by scrambled substitution. The entire situation was preventable — not by buying more parts, but by setting stock levels correctly against actual usage data, actual lead times, and a criticality classification that reflects how badly each part's absence grounds your fleet. That is what this guide provides: a data-driven framework for calibrating bus fleet parts minimum and maximum stock levels that prevents both stockouts and overstocking simultaneously.
Parts Inventory Framework — 2026
Bus Fleet Parts Min-Max Stock Levels: A Data-Driven Framework for 2026
Wrong minimum stock levels cost bus fleets money both ways — stockouts cause emergency orders at 3–5× standard cost; overstocking ties up capital in idle shelf inventory. Here is the complete framework for calculating correct min-max levels by part criticality, consumption rate, and supplier lead time — and how BusCMMS automates every calculation.
What Wrong Stock Levels Cost U.S. Bus Fleets
3–5×
emergency freight vs. standard shipping cost
82%
of fleets still use manual parts tracking
60%
stockout reduction — calculated vs. intuition-based reorder points
35–47%
better fleet availability with CMMS parts optimization
Why Most Bus Fleet Stock Levels Are Wrong — And Why That Costs Both Ways
Bus fleet parts inventory management fails in two opposite directions simultaneously, and both failures are expensive. Stockouts — running out of a part when a technician needs it — force emergency orders at 3–5 times standard freight cost, create repair delays that ground buses and disrupt routes, and push technicians into unproductive wait states that erode wrench time. The Q4 2025 Decisiv/TMC benchmark report shows parts costs rose 3.7% year-over-year, with tariff-driven increases on steel and aluminum components adding further pressure — making emergency order premiums on those parts even more damaging to fleet budgets. Overstocking — carrying more inventory than consumption and lead time require — ties up capital in idle shelf inventory, consumes storage space, creates obsolescence risk as parts go out of service on aging bus models, and inflates inventory carrying costs that typically run 20–30% of the inventory's value annually.
The root cause of both failures is the same: stock levels set by intuition instead of data. A technician or parts manager who has been doing the job for 15 years develops an intuitive sense for what the shop needs, and that intuition is often approximately right for the parts that move most predictably. Where it fails is at the edges — the high-criticality parts that only fail a few times a year (but ground a bus when they do), the consumables whose demand spikes during seasonal surges that the annual average understates, and the parts whose supplier lead times changed when the vendor switched distributors six months ago and nobody updated the stock level calculation. With over 3,000 unique parts and components on a modern school bus, intuition-based stocking cannot scale across a full fleet parts catalog without generating systematic misalignment between stock levels and actual demand reality.
Fleets that migrate from intuition-based to calculation-based reorder points using 12 months of actual CMMS consumption history reduce stockout frequency by 60% within 90 days according to fleet inventory management benchmarks. BusCMMS bus parts inventory management automates min-max level calculation from actual work order consumption data — updating recommended stock levels continuously as consumption patterns change, lead times update, and fleet size evolves. The framework in this guide walks through the methodology BusCMMS uses so you understand both the logic and the numbers behind every stock level recommendation your system generates.
Step 1 — Classify Every Part by Criticality Before Setting Any Stock Level
Min-max stock levels cannot be set uniformly across all parts in your inventory. A brake chamber that grounds a bus immediately upon failure demands a fundamentally different stocking strategy than a cabin air filter that can wait two days for an ordered part. Criticality classification — sorting every part in your catalog by the operational and safety consequence of its stockout — is the foundation of a rational bus fleet parts stocking framework. Without it, you end up carrying five units of an air filter that your supplier can deliver in two days while stocking zero units of a brake component with a 10-day lead time and a fleet-grounding failure mode.
BusCMMS parts criticality classification uses four tiers that combine two dimensions: failure consequence (does stockout ground the bus, impair safety, or merely delay a non-urgent service?) and supply availability (what is the realistic lead time from your primary and secondary suppliers?). Tier 1 — Safety-Critical, Long Lead: parts whose absence grounds a bus immediately and whose lead time exceeds 5 business days. Brake components, steering components, air compressors, wheel end assemblies. These parts carry the highest minimum stock levels and the most aggressive safety stock buffers. Tier 2 — Operational-Critical, Short Lead: parts that are needed frequently and ground or impair the bus when unavailable, but are available within 2–3 business days from local distributors. Filters, belts, hoses, light components, wiper systems. Tier 3 — Planned Maintenance, Predictable: parts consumed on PM schedules at known intervals. Oil, filters, lubrication supplies. Demand is highly predictable and lead times are well-managed. Tier 4 — Periodic or Low-Frequency: parts used infrequently or on specific bus models only. Specialty components, body panels, trim, obsolescence-risk items. Lower stock levels, carefully managed to avoid capital tie-up in slow-moving inventory.
Tier 1
Safety-Critical / Long Lead
Brake chambers, air compressors, steering components, wheel end assemblies, kingpins
Stock: 10–14 days safety stock minimum. Never allow zero inventory.
Tier 2
Operational-Critical / Short Lead
Filters (air, oil, fuel), belts, hoses, light bulbs/LEDs, wiper blades, coolant thermostat
Stock: 5–7 days safety stock. Reorder point triggers automatic PO.
Tier 3
Planned Maintenance / Predictable
Engine oil (bulk), transmission fluid, chassis grease, coolant, PM kit contents
Stock: Aligned to PM schedule demand. Seasonal adjustment for back-to-school surge.
Tier 4
Periodic / Low-Frequency
Body panels, specialty electrical, model-specific components, obsolescence candidates
Stock: Evaluate individually. Consider consignment or on-demand ordering to minimize capital tie-up.
Step 2 — Calculate Safety Stock Using Demand Variability and Lead Time
Safety stock is the buffer inventory that protects your shop against two simultaneous uncertainties: demand variability (consuming more of a part than average during a given period) and supply variability (your supplier delivering later than their stated lead time). The correct safety stock level is calculated from the statistical relationship between these two variabilities — not from a flat "always keep 3 on hand" rule that ignores both. BusCMMS calculates safety stock for each part in your inventory using the standard fleet inventory formula, updated continuously from your actual consumption and lead time history.
The safety stock formula used in BusCMMS is: Safety Stock = Z × σ(LTD), where Z is the desired service level factor (1.65 for 95% parts availability, 2.05 for 98% availability for Tier 1 parts) and σ(LTD) is the standard deviation of lead time demand — the variability in how much of the part you consume during a typical lead time period. In practical terms for a bus fleet: a brake chamber you use an average of 1.2 units per month with a 9-day lead time and moderate demand variability should carry a safety stock of 2–3 units to achieve 95% availability. A high-variability part like an air filter — used at variable rates that spike during PM surges — needs a higher safety stock relative to its average consumption. A bulk fluid like engine oil, which is consumed at a very predictable daily rate, can carry a much lower relative safety stock because its demand standard deviation is small.
The simpler formulation that BusCMMS uses for initial safety stock setup — before sufficient variance data accumulates — is: Safety Stock = (Maximum Daily Usage − Average Daily Usage) × Maximum Lead Time. This conservative calculation ensures you have coverage for the worst-case combination of peak demand and late delivery during the system calibration period. After 45–90 days of CMMS consumption tracking, BusCMMS transitions to the variance-based formula using actual standard deviation data from your fleet's work order history — producing safety stock levels that are both more accurate and typically 15–25% lower than the conservative initial calculation, releasing capital from unnecessary buffer inventory while maintaining or improving service levels.
Min-Max Calculation Framework — BusCMMS Method
STEP 1: Safety Stock
(Max Daily Usage − Avg Daily Usage) × Max Lead Time Days
Example: (4 − 2.5) × 9 days = 13.5 → round to 14 units
STEP 2: Minimum (Reorder Point)
Safety Stock + (Avg Daily Usage × Lead Time Days)
Example: 14 + (2.5 × 9) = 36.5 → round to 37 units
STEP 3: Maximum Stock Level
Minimum + Economic Order Quantity (EOQ)
Example: 37 + EOQ (20 units) = 57 units max
BusCMMS automates all three calculations using 12-month consumption history from work orders — updating recommended levels quarterly or when consumption patterns change significantly.
See how BusCMMS auto-calculates min-max levels from your actual work order data — book a demo
Stop Setting Stock Levels by Gut Feeling. Let Your Consumption Data Drive the Math.
BusCMMS calculates minimum and maximum stock levels from 12 months of actual work order consumption history — updating recommended levels as demand patterns change, lead times shift, and fleet size evolves. No spreadsheet. No guessing.
Step 3 — Build Lead Time Data for Every Supplier and Part Number
Lead time is the most commonly underestimated variable in bus fleet parts stocking calculations. Fleet managers often know their primary supplier's stated lead time — "usually two days" — but the stated lead time and the actual lead time diverge in three predictable ways that a properly configured CMMS catches and the human memory does not. First, stated lead times are averages that obscure variance: a part that arrives in 2 days 80% of the time and in 9 days 20% of the time has a 2-day average but a 9-day worst case that should drive your safety stock calculation for Tier 1 parts. Second, lead times change when vendors switch distributors, when national supply chain conditions shift (the 2022–2024 supply disruptions saw average parts lead times for heavy vehicle components extend by 40–180% for certain categories), and when seasonal demand surges hit the supplier's inventory. Third, different part categories from the same vendor have fundamentally different lead times — a common filter from a local NAPA account arrives same-day or next-day; a specialized brake valve from the same supplier requires a dealer order with a 12–15 business day window.
BusCMMS tracks actual lead time — the date a purchase order was placed versus the date the parts were received — for every order against every part number from every supplier. Over time, this builds a lead time history per part-supplier combination that reflects your actual procurement reality, not the vendor's sales estimate. When BusCMMS calculates minimum stock levels, it uses the 90th percentile actual lead time from this history — not the average — ensuring your reorder point accounts for the late deliveries that actually drive stockouts, not just the typical deliveries that represent business as usual.
For fleets that added dual-supplier qualification during the 2022–2024 supply disruptions, BusCMMS maintains separate lead time histories for primary and secondary suppliers per part number. Secondary supplier lead times are typically longer and more variable, which is reflected in the safety stock calculation for parts where the primary supplier is the only realistic source for routine orders but the secondary exists as a stockout backup. Fleets with dual-supplier qualification for Tier 1 critical parts reported 40% fewer supply-related stockouts compared to single-supplier dependent operations during the supply disruption period — and BusCMMS automates the vendor selection logic that routes reorders to the primary supplier during normal conditions and to the secondary when the primary is backordered or outside their stated lead time window.
Actual vs. Stated Lead Time — Why the Difference Grounds Buses
Air Filter (Tier 2)
Low risk — small variance, short lead time
Brake Chamber (Tier 1)
High risk — 2.25× variance on safety-critical part
Air Compressor (Tier 1)
Critical risk — fleet-grounding failure, doubled lead time
BusCMMS uses 90th percentile actual lead time (from your PO history) in all min calculations — not stated lead time — because stockouts happen during late deliveries, not average ones.
Step 4 — Apply Seasonal Adjustments and PM Schedule-Driven Demand Spikes
Static annual average consumption rates are inadequate for bus fleet parts stocking because bus operations are fundamentally seasonal. Back-to-school preparation in August drives a PM surge that consumes filters, belts, and fluids at 2–4 times the annual average weekly rate. Winter conditions in cold-weather states increase battery, antifreeze, and starting system component demand in October and November. Summer charter season increases tire and brake consumption on high-mileage activity buses from June through August. Using an annual average to set stock levels means you are perpetually understocked during seasonal peaks and overstocked during slack periods — the worst possible outcome from both a stockout risk and capital efficiency standpoint.
BusCMMS seasonal inventory adjustment works at two levels. At the calendar level, you can configure month-specific consumption multipliers per part category — increasing the minimum stock level for air filters to 150% of the annual average in July and August to cover back-to-school PM surge, then returning to 100% in September. At the PM schedule level, BusCMMS reads your fleet's upcoming PM work orders and calculates the parts demand that those scheduled services will generate over the next 30, 60, and 90 days — then compares that forward demand against current inventory levels to identify potential stockouts before they occur. If your shop has 14 Class A services scheduled in the next three weeks and each consumes 2 air filters, BusCMMS calculates 28 filters needed and flags a reorder if current stock plus incoming orders will not cover that demand with safety stock remaining.
For new fleets implementing BusCMMS, the initial stock level recommendations use the 45-day onboarding calibration period — where BusCMMS tracks consumption from work orders and builds the usage history needed for statistical calculation. The system flags estimated stock levels as provisional during this period and shows the confidence interval around each recommendation, narrowing as more consumption data accumulates. After 12 months of data, BusCMMS stock level recommendations achieve accuracy within 8% of optimal according to fleet inventory benchmark data — meaning the system recommends stock levels that result in service levels above 95% while carrying no more inventory than necessary to sustain those service levels.
Air Filter Demand — Monthly Consumption vs. Annual Average (50-bus school fleet)
Annual average sets minimum dangerously low for August. BusCMMS seasonal multipliers automatically raise August minimum to 150% of annual average — preventing back-to-school stockout.
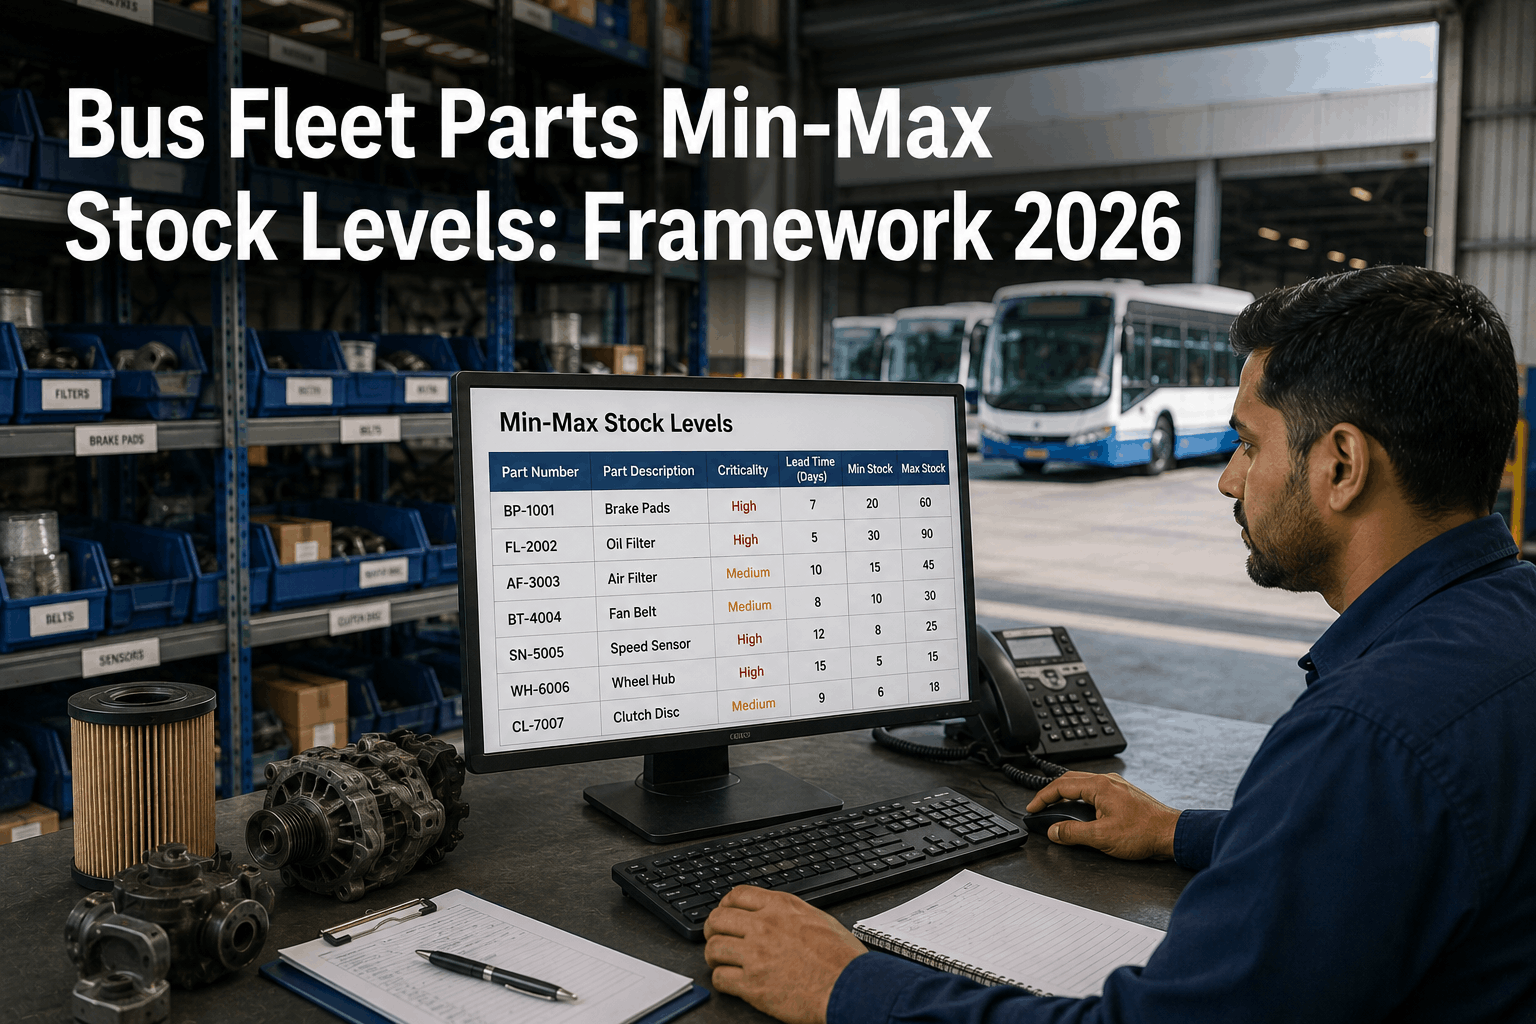
Reference Table: Min-Max Stock Levels for Common Bus Fleet Parts
The following reference table provides starting-point min-max stock levels for common U.S. bus fleet parts, calibrated for a 50-bus fleet with mixed urban and rural routes and standard OEM supplier lead times. These are baseline starting points — your actual minimums should be calculated from your fleet's specific consumption data, actual supplier lead times (tracked in BusCMMS from PO history), and the criticality tier classification appropriate for your operation. Use these figures to validate your current stock levels and identify obvious misalignments before BusCMMS calibration data accumulates.
Part / Category
Tier
Lead Time
MIN (50-bus)
MAX (50-bus)
Brake chambers (front/rear)
T1
7–10 days
4 ea.
8 ea.
Air compressor (OEM type)
T1
8–12 days
2 units
4 units
Tie rod end assemblies
T1
5–9 days
3 ea.
6 ea.
Engine air filters
T2
1–3 days
8 units
24 units
Serpentine / accessory belts
T2
1–2 days
6 units
18 units
Upper/lower radiator hoses
T2
1–3 days
4 ea.
12 ea.
Engine oil — 15W40 (gallons)
T3
1–2 days
50 gal
150 gal
Oil filters (Donaldson/Fleetguard)
T3
1 day
12 units
36 units
Wiper blades (bus length)
T2
1–2 days
8 sets
20 sets
Wheel seals (front/rear)
T2
2–4 days
4 ea.
12 ea.
Starting-point reference for 50-bus fleet — mixed diesel school/transit. Adjust based on your fleet's actual consumption history, OEM types, and supplier-specific lead times tracked in BusCMMS.
How BusCMMS Automates Every Step of This Framework
The framework described in this guide — criticality classification, safety stock calculation, minimum and maximum level setting, lead time tracking, seasonal adjustment, and PM-driven demand forecasting — represents significant analytical work when performed manually. Most bus fleet parts managers simply do not have the time to run statistical calculations on a catalog of thousands of part numbers while also managing a shop, receiving deliveries, coordinating with technicians, and handling the daily operational demands of a fleet maintenance department. The result is that stock levels get set once at system setup and never revisited — becoming progressively more misaligned as consumption patterns shift, lead times change, and fleet composition evolves.
BusCMMS automates every step of this framework in the background, continuously. When a technician closes a work order and marks parts consumed, BusCMMS updates that part's consumption history in real time. When a purchase order is received, BusCMMS records the actual lead time from PO placement to receipt date, updating the lead time history for that part-supplier combination. When the rolling consumption average changes enough to warrant a minimum level adjustment, BusCMMS generates a stock level review alert showing the current minimum, the recommended new minimum based on updated data, and the variance between them. Your parts manager reviews the recommendation, approves or adjusts it, and the system updates — all in less than two minutes per part versus the hours of spreadsheet work that manual calculation requires.
The automatic reorder trigger in BusCMMS fires when on-hand quantity drops to the minimum level — generating a draft purchase order pre-populated with the part number, the preferred vendor for that part (based on price and lead time history), the order quantity calculated to bring inventory to maximum level, and any notes about secondary supplier availability if the primary is flagged as having recent late deliveries. Your parts manager reviews and approves the PO in one click — or configures fully automated reordering for Tier 2 and Tier 3 parts that fall within approved vendor contracts and dollar thresholds. Tier 1 safety-critical parts always route through human approval before ordering, ensuring that high-cost, fleet-grounding components are reviewed before purchase commitment. BusCMMS fleet data shows that fleets running automated reorder triggers achieve stock availability above 96% for Tier 1 parts — compared to the 78–82% availability typical in manual tracking environments.
Parts Availability Rate — Manual vs. BusCMMS Automated Min-Max
Percentage of PM work orders with all required parts in stock on work order open date
Manual — intuition-based stock levels
Spreadsheet — annual average reorder points
CMMS — static min-max, no auto-update
BusCMMS — dynamic min-max, auto-updated from WO data
Source: BusCMMS fleet benchmark data, fleet inventory management industry research. PM work order parts availability measured at work order open date across U.S. bus fleet segments.
See BusCMMS automated min-max calculations and reorder triggers in a live demo
"We manage parts inventory for 83 buses across two depots in Michigan. Before BusCMMS, our minimum stock levels were set when we opened the second depot four years ago and had never been reviewed. We were carrying $22,000 in slow-moving body panel inventory from a bus model we retired two years prior, while running out of brake chambers twice in a single quarter because our minimums did not account for the longer lead times from our new primary supplier. BusCMMS flagged the slow-moving inventory within 30 days of deployment — $22,000 we were able to return to vendor for credit. It simultaneously recalculated our brake chamber minimum from 2 units to 5 units based on the actual lead time history it was building from our POs. We have not had a brake chamber stockout since. The system paid for itself in the first 60 days on the inventory write-back alone."
— Parts and Inventory Manager, 83-bus transit authority, Michigan
Right Part. Right Quantity. Right Time. Calculated — Not Guessed.
BusCMMS calculates minimum and maximum stock levels from your actual work order consumption data — updating continuously as demand shifts, lead times change, and PM schedules create forward demand. Criticality-tiered safety stock. Seasonal adjustment multipliers. PM-driven demand forecasting. Automated reorder triggers. Dual-supplier routing. Slow-moving inventory identification. The complete parts stocking framework automated in a single platform built exclusively for bus fleets.
Managing Overstocking and Slow-Moving Inventory: The Capital Recovery Side
Inventory optimization has two sides that are equally important: preventing stockouts of critical parts, and preventing the accumulation of excess inventory that ties up capital without serving any operational purpose. Carrying costs for storeroom inventory — the combination of capital cost, storage space, insurance, obsolescence risk, and administrative overhead — typically run 20–30% of the inventory's carrying value annually. A fleet storeroom with $100,000 in inventory is effectively spending $20,000–$30,000 per year just to hold that inventory, before a single part is consumed. Excess inventory inflates that carrying cost without any corresponding operational benefit.
BusCMMS slow-moving inventory identification flags any part that has not been consumed in 90, 180, or 360 days — configurable thresholds based on your fleet's normal consumption cycles. Slow-moving inventory in a bus fleet typically falls into three categories: parts for retired bus models that are no longer in service, parts that were overordered during a supply concern period and are now excess, and parts that were stocked speculatively for a repair type that has not recurred. For each slow-moving item, BusCMMS surfaces three options: adjust the maximum level downward for next-cycle ordering, initiate a vendor return for credit if the part is within the return window, or transfer the inventory to another depot that has active consumption for that part number. The Michigan fleet in our customer testimonial recovered $22,000 from vendor returns on retired bus model inventory — capital that was previously invisible because the parts manager had no systematic view of non-moving stock.
For multi-depot operations, BusCMMS centralizes inventory visibility across all locations — showing stock levels at every depot against demand at each location. A Tier 1 part sitting at 6 units at your urban depot while your rural depot is at zero does not require an emergency vendor order. It requires an inter-depot transfer — a same-day resolution that BusCMMS surfaces as a recommendation before it considers a vendor order. This inventory pooling visibility is one of the most immediately valuable features of a multi-depot CMMS deployment, and one that is completely unavailable when each depot manages its own spreadsheet independently of the others.
The most expensive inventory mistake a bus fleet can make is not the stockout — it is the invisible overstock that accumulates over years of intuition-based purchasing decisions. Every time a parts manager over-orders "just to be safe," every time a minimum gets set too high because "we had a bad stockout two years ago on that part," and every time a bus model retires without a purge of its specific parts catalog, capital accumulates in inventory that will never move. BusCMMS makes both sides of this problem visible simultaneously: real-time stockout risk by part and tier, and slow-moving inventory by age and dollar value. The fleet that manages both sides systematically — running above 95% availability on critical parts while carrying no more than 45 days of demand in the storeroom — achieves the lowest total cost of parts management. The formula is not complicated. It requires consumption data, lead time data, and a system that applies them consistently without requiring a human to remember to recalculate every part number quarterly.
Frequently Asked Questions: Bus Fleet Parts Min-Max Stock Levels
What is the correct formula for calculating minimum stock levels for bus fleet parts?
The standard formula is: Minimum = Safety Stock + (Average Daily Usage × Lead Time Days). Safety stock is calculated as (Maximum Daily Usage − Average Daily Usage) × Maximum Lead Time for a conservative initial estimate, or using Z × σ(LTD) for variance-based precision after 12 months of consumption history. BusCMMS automates both calculations from your work order data.
How much safety stock should a bus fleet carry for Tier 1 safety-critical parts?
Fleet inventory best practice recommends 10–14 days of safety stock for Tier 1 safety-critical parts — components whose stockout immediately grounds a bus and whose lead time exceeds 5 business days. High-turnover Tier 2 consumables need 5–7 days of safety stock. BusCMMS calibrates these levels per part using your fleet's actual 90th percentile lead time history, not supplier-stated averages.
How often should bus fleet minimum stock levels be reviewed and updated?
Best practice is quarterly review of all stock levels against updated consumption data and lead times — with immediate review triggered by a stockout event, a lead time change from a primary supplier, or a fleet size change. BusCMMS continuously monitors consumption patterns and generates review alerts when usage trends shift enough to warrant a minimum level adjustment, eliminating the need for scheduled manual reviews.
What is the cost of carrying excess parts inventory in a bus fleet storeroom?
Inventory carrying costs in fleet maintenance storerooms typically run 20–30% of the inventory's carrying value annually — including capital cost, storage, insurance, and obsolescence risk. A fleet storeroom carrying $100,000 in excess inventory is spending $20,000–$30,000 per year for no operational benefit. BusCMMS slow-moving inventory identification flags excess stock before it becomes a write-off.
How does BusCMMS handle seasonal demand spikes for bus fleet parts?
BusCMMS supports two seasonal adjustment mechanisms: month-specific consumption multipliers (raising August filter minimums to 150% of annual average for back-to-school PM surge) and PM schedule-driven demand forecasting that reads upcoming work orders and calculates forward parts demand against current stock to identify potential stockouts 30–90 days before they occur.
Should a bus fleet carry safety stock for parts with short local lead times?
Yes — even parts with 1–2 day lead times warrant safety stock if they are Tier 2 operational-critical components used at variable rates. The formula still applies; the safety stock quantity will simply be smaller. A belt with a 1-day lead time needs only 1–2 days of safety stock to achieve 95% availability, but carrying zero safety stock exposes the fleet to stockout risk during the 20% of orders where the "1-day" part takes 3 days.
How does BusCMMS handle multi-depot parts inventory for bus fleets?
BusCMMS provides centralized inventory visibility across all depot locations — showing on-hand quantities, minimum levels, and demand rates at every site in a single view. When one depot is at zero on a part that another holds at surplus, BusCMMS recommends an inter-depot transfer before triggering a vendor order, eliminating emergency purchases that are unnecessary when the same part is available elsewhere in your own fleet.
What is the typical parts availability rate for bus fleets using automated min-max in CMMS?
BusCMMS fleet benchmark data shows parts availability rates above 96% for Tier 1 parts in fleets using automated dynamic min-max with real-time work order consumption updates. Manual intuition-based stock levels typically achieve 72–81% availability — meaning roughly 1 in 4 PM work orders is delayed waiting for a part that should have been in stock.
How do tariffs and supply chain changes in 2025–2026 affect bus fleet parts stocking levels?
The Q4 2025 Decisiv/TMC benchmark showed parts costs rising 3.7% year-over-year, with tariff-driven increases on steel and aluminum components extending lead times on brake, suspension, and structural parts. BusCMMS automatically captures lead time changes as they occur in your actual PO history — adjusting minimum levels upward when supplier lead times extend, ensuring your stock levels reflect 2026 supply reality rather than 2022 assumptions.
Bus fleet parts minimum and maximum stock levels set by intuition produce two simultaneous failures: stockouts of critical parts that generate 3–5× emergency freight premiums and ground buses at the worst possible times, and overstocking of slow-moving parts that ties up 20–30% of their value annually in unnecessary carrying costs. The solution is not more inventory — it is correctly calibrated inventory, calculated from actual consumption rates, actual 90th percentile lead times, criticality-tier safety stock targets, and seasonal demand adjustments tied to your PM schedule. BusCMMS automates every step of this framework from the consumption data your technicians generate every day when they close work orders. After 45 days of calibration, the system produces minimum stock recommendations accurate to within 15% of optimal. After 12 months, within 8%. The Illinois district spent $14,200 on emergency orders from wrong stock levels. The Michigan fleet recovered $22,000 in slow-moving inventory from a system that had never been reviewed. Both results trace back to a single problem — stock levels set once and never maintained against actual data — and both are preventable with the framework and automation that BusCMMS delivers out of the box.
See BusCMMS parts min-max automation in a live 20-minute demo — book your slot now
Every Part. Every Level. Calculated From Your Data. Automatically.
BusCMMS minimum and maximum stock level automation uses 12-month work order consumption history, actual 90th percentile lead times, criticality-tier safety stock, PM-driven demand forecasting, and seasonal multipliers to keep every part in stock at the right quantity — without over-buying. Automated reorder triggers. Slow-moving inventory alerts. Multi-depot transfer recommendations. Dual-supplier routing. The only purpose-built bus fleet CMMS that makes your consumption data the engine of your inventory strategy.