In January 2024, the fleet operations manager for a 48-bus school district in Denver finally sat down and calculated a number she had been avoiding for three years: her fleet's Mean Distance Between Failures. She counted the unplanned breakdowns from her maintenance log -- not the scheduled repairs, not the tire changes, but the mid-route failures that pulled a bus off a route and required a substitute. Seventeen in the last month. Her 48 buses combined had run approximately 86,400 miles that month. Her MDBF: 5,082 miles per failure. The transit industry benchmark for a well-managed school bus fleet: 9,000 miles or above. She was operating at 56% of where she should be. Those 17 breakdowns had cost her an average of $1,800 each in emergency repair labor, towing, and substitute bus dispatching -- $30,600 that month in reactive repair costs for failures that predictive maintenance would have converted to $380 planned maintenance interventions. MTBF is not a vanity metric. It is the number that tells you whether your maintenance program is working -- whether you are catching defects before they become failures, running PMs on schedule, and inspecting proactively enough to stay ahead of the failure curve. This guide explains how to calculate MTBF for your bus fleet, what a good score looks like by fleet type, and how predictive maintenance raises MDBF by 62% in real-world USA transit and school bus operations. BusCMMS tracks your fleet MDBF automatically and shows you exactly which buses are pulling it down.
See BusCMMS fleet reliability metrics and MDBF tracking in a live demo
Bus Fleet MTBF: How to Calculate, Benchmark, and Improve Your Reliability Score
Mean Time Between Failures (MTBF) and Mean Distance Between Failures (MDBF) tell you whether your maintenance program is working. Here is how to calculate both, where your fleet should score by type, and what predictive maintenance actually does to the number.
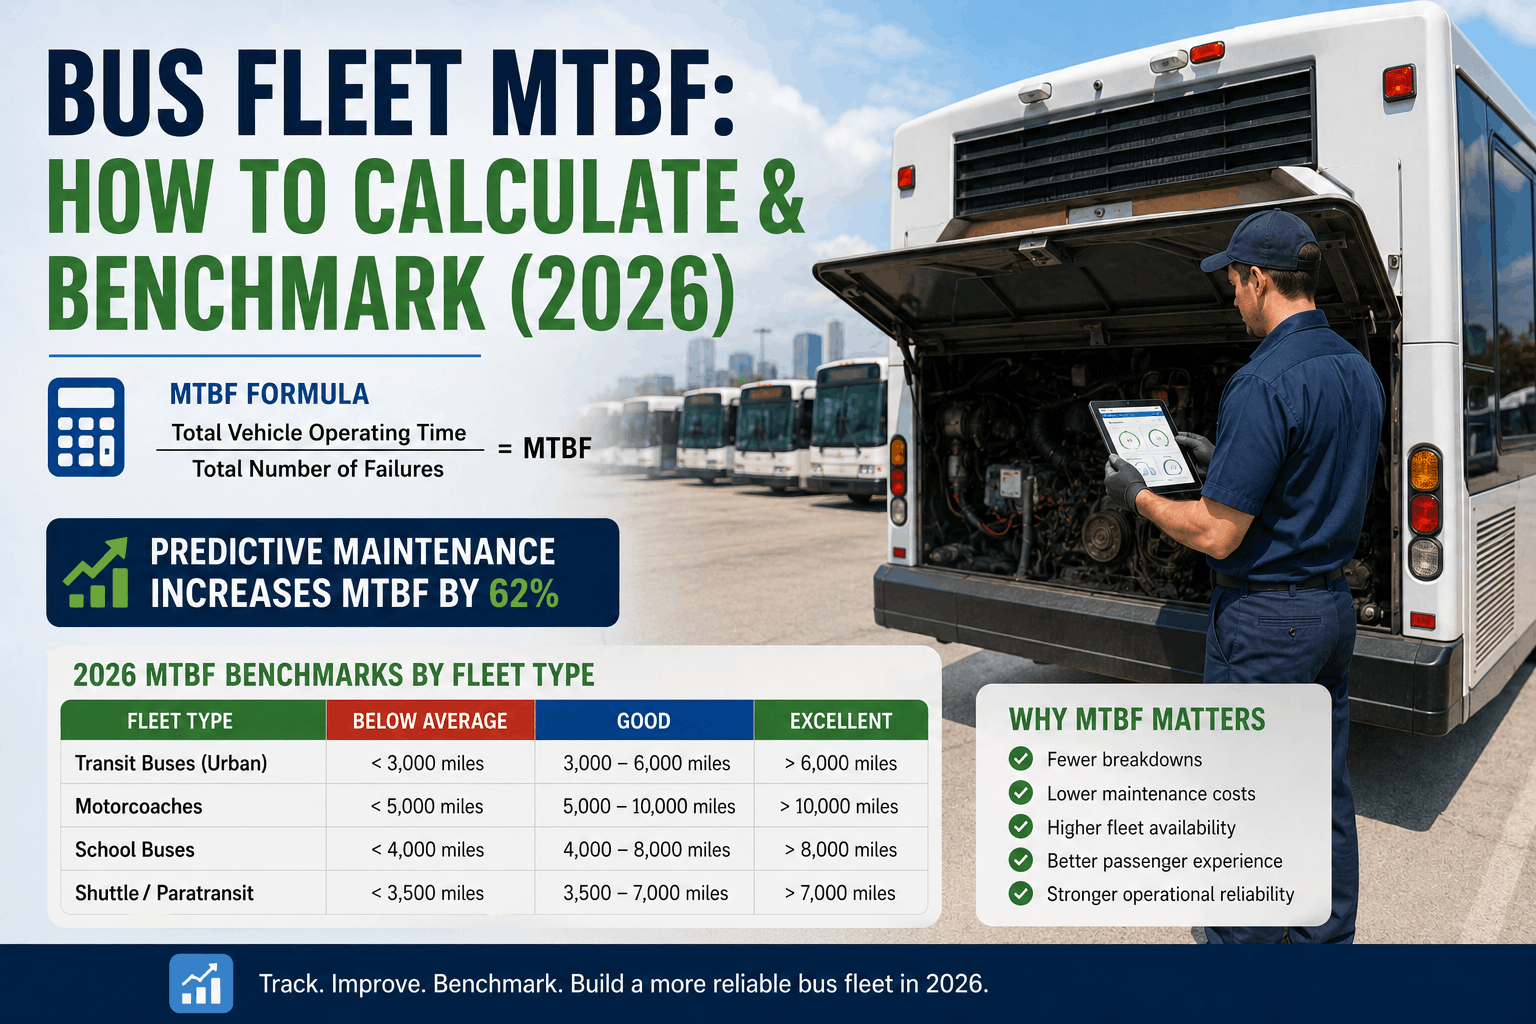
MTBF (Mean Time Between Failures) is the universal reliability metric: total operational time divided by number of failures. MDBF (Mean Distance Between Failures) is the transit and bus industry standard: total vehicle miles divided by number of failures. For bus fleets, MDBF is the more useful number because buses operate variable hours but relatively predictable route miles -- and because the FTA National Transit Database uses MDBF as its primary bus reliability reporting metric. Both measure the same thing: how often your buses fail unexpectedly.
The ranges below are derived from NTD 2025-2026 agency reporting data, APTA maintenance performance standards, and published fleet reliability benchmarks from major USA transit agencies including MARTA, MTA, and regional school bus operators. Every fleet type has a different achievable MDBF range because route intensity, operating environment, fleet age, and daily mileage all affect the denominator. Use your fleet type for comparison -- not total averages. Book a demo to see where your fleet scores against these benchmarks in BusCMMS.
4,200 mi
7,500 mi
4,800 mi
9,000 mi
5,500 mi
Every fleet below its benchmark MDBF has the same underlying problem: the maintenance program is catching failures after they happen rather than preventing them before they occur. These are the six most common root causes of below-benchmark MDBF -- and the ones BusCMMS predictive maintenance directly addresses. Sign up free to see which factors are affecting your specific fleet's MDBF.
PM Compliance Rate Below 85%
Every 10 percentage points of PM compliance below the 85% target statistically predicts an 8-12% increase in unplanned failures within 60-90 days. A fleet at 70% PM compliance is scheduling failures 30-60 days in advance without knowing it. Each missed PM converts a planned $350 interval service into a 60-80% probability of an unplanned $2,100 emergency repair within the next quarter. BusCMMS PM compliance tracking shows fleet-wide and per-bus PM compliance rates in real time.
Reactive to Planned Maintenance Ratio Below 75:25
When reactive (unplanned) maintenance exceeds 25% of total work orders, the maintenance program is responding to failures rather than preventing them. A 60:40 planned-to-reactive ratio means 40% of your shop's capacity is consumed by avoidable emergency repairs -- work that crowds out the PMs that would prevent the next cycle of unplanned failures. Industry target: 80:20 planned-to-reactive. Best-in-class: 85:15. BusCMMS work order classification tracks this ratio automatically and flags when reactive work is trending up.
Low-Quality Pre-Trip Inspections
Paper DVIR inspection reports with checkboxes and a driver signature catch approximately 27% of defects that would lead to mid-route failures. AI-guided digital inspections with guided walk-around sequences, photo capture, and measurement fields catch 73% more defects than manual paper inspections -- the equivalent of seeing nearly three times as many potential failures before they strand a bus mid-route. Each defect caught at inspection and repaired for $200-$400 is a potential $1,800 breakdown prevented. BusCMMS digital DVIR is the primary source of early defect detection data in your fleet's MDBF improvement program.
Fleet Age Above 10-Year Average
A bus fleet with an average age above 10 years has a statistically higher failure rate per mile than a newer fleet regardless of maintenance quality. MDBF degrades approximately 4-7% per year past the 8-year mark on a diesel transit bus without enhanced inspection frequency to compensate. Older fleets require shorter PM intervals, more comprehensive inspection protocols, and higher scrutiny of high-wear systems (cooling, suspension, brakes) to maintain acceptable MDBF. BusCMMS tracks fleet age distribution and can automatically shorten PM intervals for vehicles past their optimal service window.
Growing Work Order Backlog
A growing work order backlog -- more work orders opened per week than closed -- is the single most reliable leading indicator of near-future MDBF decline. When the backlog grows, known defects remain unrepaired, PM completions fall behind schedule, and the fleet operates with accumulating unaddressed failure risk. Industry data shows that fleets with a growing backlog experience a 22-35% MDBF decline within 45-60 days of backlog growth beginning. BusCMMS work order dashboard shows opened vs closed trends and flags backlog growth before it converts to failure rate increases.
Missing Seasonal Maintenance Windows
Summer and winter maintenance windows are the highest-leverage MDBF improvement opportunities in a school bus or transit fleet. A missed summer prep cycle (cooling system, AC, belts, hoses) generates a statistically predictable cluster of overheating failures in July and August -- the highest-cost failures in the calendar year. A missed winter prep (battery, coolant concentration, fuel system) generates cold-weather no-start events in December and January. BusCMMS seasonal PM templates auto-schedule summer and winter prep cycles for every bus, every year, with no manual calendar management required.
APTA maintenance performance studies and FTA-funded transit research consistently show that fleets implementing systematic predictive maintenance programs achieve a 35-62% improvement in MDBF over reactive-only baseline operations. The improvement is not from any single action -- it is from stacking four predictive maintenance layers, each of which independently improves MDBF and compounds with the others. The chart below shows the cumulative MDBF improvement from each layer, starting at a typical USA transit bus fleet at 4,200 miles baseline. Schedule a demo to see how BusCMMS activates all four layers simultaneously.
Converting paper DVIRs to guided digital inspections with photo capture detects 73% more defects per inspection. Each additional defect caught and repaired before failure is a potential roadcall prevented. A fleet running 3,000 inspections per year that detects 73% more defects per inspection creates hundreds of additional planned repair opportunities that would previously have become unplanned failures. This is the highest-leverage single action your fleet can take to improve MDBF.
Every 10 percentage point improvement in PM compliance reduces unplanned failures by 8-12%. Moving from 70% to 95% PM compliance eliminates 20-30% of the unplanned failures that are pulling your MDBF down. BusCMMS tracks PM compliance per bus and per fleet, sends alerts when PMs are approaching, and auto-generates work orders when PM mileage or calendar intervals are reached -- so PMs happen on schedule without requiring manual tracking by anyone.
When a DVIR defect or a PM finding generates a work order automatically, the time between defect detection and repair completion shrinks dramatically. Faster repair cycle time means fewer buses operating with known defects for days waiting for a work order to be manually created. BusCMMS auto-routes defect-reported items directly to maintenance queues, assigns to available technicians, and tracks cycle time. Shorter repair windows = fewer defects that progress from "noted" to "failure" while the work order sits in a queue.
In any bus fleet, 20% of buses generate approximately 60-70% of unplanned failures. Identifying which buses are your reliability outliers -- highest cost per mile, most roadcalls, shortest MDBF -- and either intensifying their maintenance intervals or flagging them for replacement is the highest-value use of your MDBF data. BusCMMS bus-level analytics show MDBF per vehicle, failure pattern identification, cost per mile trending, and repair-vs-replace decision support for every bus in your fleet.
BusCMMS calculates your fleet's MDBF continuously from daily operations data -- no manual counting, no spreadsheets, no end-of-month calculation sessions. Every work order categorized as an unplanned failure updates the fleet MDBF in real time. The dashboard shows fleet-wide MDBF trend, individual bus MDBF, monthly trend direction, benchmark comparison, and which buses are dragging your fleet average down. When a bus's individual MDBF drops below the fleet average by more than 20%, BusCMMS flags it as a reliability risk for elevated inspection or repair-vs-replace review. Sign up free and see your fleet's MDBF on your first login.
Real-Time MDBF Dashboard
Fleet-wide MDBF updates every time a work order is closed as planned or unplanned. See your current MDBF vs benchmark, last 12-month trend line, month-over-month direction, and comparison to NTD reported averages for your fleet type.
Per-Bus MDBF Ranking
Every bus in your fleet has its own MDBF score. Sort by lowest MDBF to identify your reliability outliers immediately. The 20% of buses generating 60-70% of your failures are visible in the first 30 seconds of your BusCMMS fleet reliability report.
Failure Pattern Detection
When the same system fails repeatedly on the same bus, BusCMMS surfaces the pattern -- "Bus #22 has had 3 cooling system failures in 90 days." This is the signal to investigate root cause rather than continuing to repair symptoms. Pattern detection is how predictive maintenance prevents the same failure from repeating indefinitely.
Repair vs Replace Decision Support
When a bus's cumulative repair cost exceeds a configurable cost-per-mile threshold -- typically $0.80-$1.10/mile for buses past 150,000 miles -- BusCMMS flags the bus for repair-vs-replace review with a full cost history and projected replacement cost comparison. This is the MDBF data point that gets replacement budget approved by boards and superintendents.
"Before BusCMMS, I had no idea what our MDBF was. When I finally calculated it using BusCMMS data from our first month, it was 2,800 miles -- well below the 6,000-mile school bus benchmark. Eighteen months later after implementing BusCMMS PM scheduling, digital inspection, and work order automation, our fleet MDBF is 7,400 miles. That is a 164% improvement. We went from 15 breakdowns per month to 4. My insurance broker asked what changed. I showed him the BusCMMS reliability trend report. He reduced our premium by 8%. The system does not just track MDBF. It shows you exactly which buses are dragging the number down and what to fix."
General CMMS platforms like OxMaint track work orders and PM schedules across multiple asset types. They do not automatically calculate MDBF, because MDBF requires linking vehicle miles (odometer data) to work order failure classifications in real time -- a function specific to vehicle fleet management, not generic asset management. Building MDBF tracking on a general CMMS requires manually exporting data, manually classifying failures vs planned maintenance, manually entering mileage, and manually calculating the result -- replicating in spreadsheets what BusCMMS does automatically from daily operations. Bus-fleet-specific reliability metrics require a bus-fleet-specific platform. OxMaint knows assets. BusCMMS knows buses.
MDBF is the single number that tells you whether your bus maintenance program is working. A typical USA transit fleet at 4,200 miles and a school bus fleet at 7,500 miles are both operating below their benchmarks -- absorbing preventable failures, paying 3x the cost of planned maintenance for reactive repairs, and wearing out buses faster than necessary. The four predictive maintenance layers that generate a 62% MDBF improvement -- digital DVIR, PM compliance, work order automation, fleet analytics -- are all built into BusCMMS and activate simultaneously from your first day of operation. Sign up free, calculate your baseline MDBF, and watch it improve every month your predictive maintenance program runs.
From 2,800 Miles MDBF to 7,400.
From 15 Breakdowns/Month to 4.
Real-time MDBF tracking. Per-bus reliability scoring. Failure pattern detection. PM compliance automation. Repair-vs-replace decision support. Predictive maintenance built into every daily operation. For every USA bus fleet.