Understanding total cost of ownership (TCO) over a bus fleet's operational lifespan is critical for capital procurement decisions, depreciation planning, and route-level pricing analysis. A 50-bus fleet operating for 12 years accumulates over $28-42 million in direct operating costs depending on bus type (diesel, hybrid, electric), terrain (highway vs urban), driver productivity, and maintenance discipline. Traditional diesel buses offer proven reliability and lower upfront costs but face rising fuel prices, regulatory emissions restrictions, and aging component reliability challenges. Hybrid-electric buses reduce fuel consumption 25-35% while maintaining familiar operational procedures, appealing to cost-conscious operators seeking incremental efficiency gains. All-electric buses promise zero-emission operation and dramatically lower fuel costs but demand substantial infrastructure investment, range limitations, and battery replacement uncertainty beyond standard warranty periods. Most fleet operators cannot adequately compare these options without comprehensive TCO modeling incorporating purchase price, fuel costs, maintenance, parts obsolescence, residual value, financing costs, regulatory compliance, insurance, and unexpected capital expenses. BusCMMS provides enterprise-grade TCO analysis comparing all three powertrain options across 12-year lifecycles, scenario modeling for different operational profiles, and decision support for capital budget requests and board presentations. Our research-backed 2026 cost data includes current diesel/CNG/electric pricing, component lifecycle costs, manufacturer warranty limitations, and real-world failure patterns from thousands of deployed buses. Make confident capital equipment decisions that maximize net present value and operational reliability. Schedule a TCO consultation with our fleet economics experts.
Bus Fleet Total Cost of Ownership (TCO): 50 Buses Over 12 Years
Complete 2026 Cost Analysis: Diesel, Hybrid, and Electric Buses With Real-World Operational Data
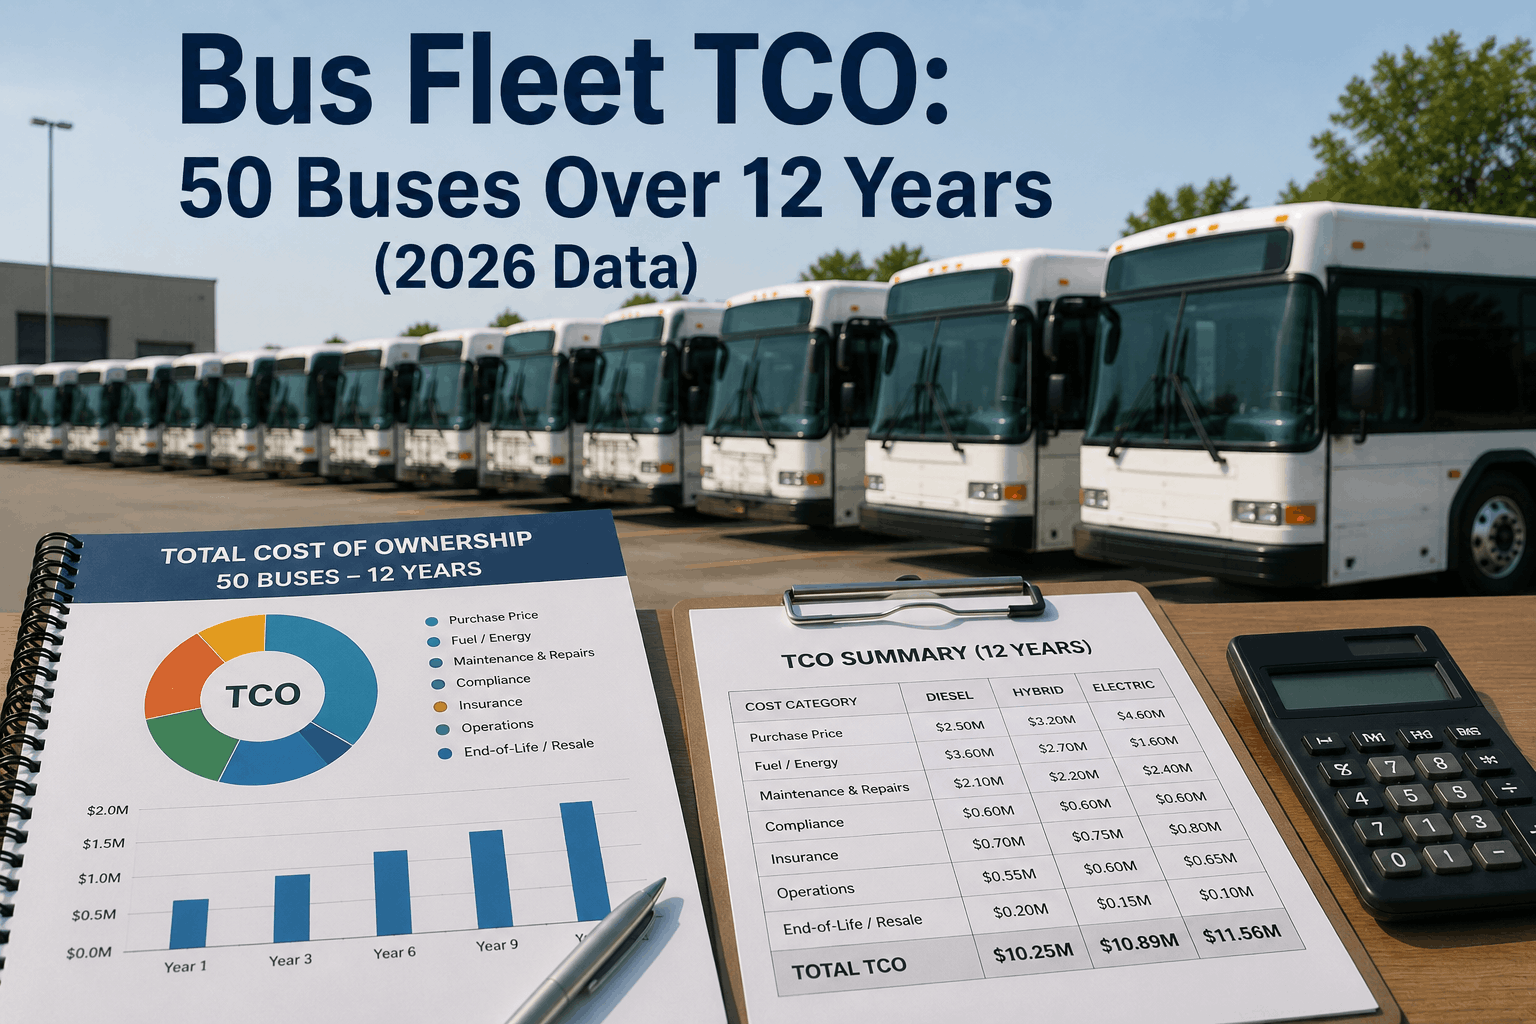
50-Bus Fleet TCO Overview: Diesel vs Hybrid vs Electric
Complete 12-year ownership cost comparison across three powertrain technologies, assuming urban transit operation (35,000-40,000 miles/year per vehicle):
Diesel Buses (Standard Powertrain)
$420,000
$21,000,000
$8,400,000 (5.8 mpg avg, $3.85/gal)
$4,200,000 (oil changes, filters, wear items)
$1,800,000 (transmissions, engines at 500K mi)
$750,000
$2,100,000
$1,400,000
-$1,050,000
$35,800,000
$5.96/mile
Hybrid Buses (Diesel-Electric)
$485,000
$24,250,000
$5,250,000 (8.2 mpg avg, 28% savings)
$3,150,000 (reduced friction brakes)
$400,000 (8-12 year battery life)
$700,000 (slightly longer tire life)
$2,470,000
$1,450,000
-$850,000
$32,400,000
$5.40/mile
Electric Buses (Battery-Electric)
$550,000
$27,500,000
$3,500,000 (depot chargers, grid upgrades)
$2,100,000 (3.5 mi/kWh, $0.14/kWh)
$1,500,000 (mostly brakes, suspension)
$2,800,000 (8-10 year life)
$500,000
$3,100,000
$1,300,000 (5-10% lower rates)
-$400,000
$38,200,000
$6.36/mile
Detailed TCO Cost Components: Where Your Fleet Money Goes
Breakdown of major cost categories contributing to 12-year fleet ownership expense:
New bus acquisition cost (equipment + delivery). Diesel $420K, Hybrid $485K (+15%), Electric $550K (+31% vs diesel). Used bus market: 3-5 year used buses 30-40% discount. Fleet bulk purchases: 5-10% volume discount from manufacturers.
Diesel: $8.4M (5.8 mi/gal). Hybrid: $5.25M (8.2 mi/gal, 37% savings). Electric: $2.1M (grid charging only). Varies by geography (CA fuel prices 20% higher), driving cycles (highway 20% better efficiency), and driver training impact (10-15% variance).
Diesel: $4.2M (oil changes, filters, wear items). Hybrid: $3.15M (30% lower due to regenerative braking). Electric: $1.5M (no fluids, much lower wear). Predictive maintenance programs reduce costs 12-18%. Parts availability affects costs significantly (established diesel supplies vs emerging hybrid/electric supply chains).
Diesel: $1.8M (engine, transmission, driveline at 500K miles). Hybrid: $800K (no engine overhaul needed). Electric: $300K (minimal overhaul needs). Battery replacement dominates electric TCO: $280K-320K per battery pack per vehicle; 8-12 year lifespan; warranty covers first 5-8 years typically.
Diesel 5-year @ 6%: $2.1M. Hybrid 5-year @ 6.5%: $2.47M (slightly higher rates). Electric 6-year @ 5.5%: $3.1M (longer amortization, lower rates due to green incentives). Consider operating leases (0% interest) vs purchase for fleet flexibility trade-off.
$1.3M-1.45M over 12 years. Electric buses: 5-10% lower insurance (lower risk profile). Urban fleets: 15-20% higher rates than highway. CSA safety scores affect rates significantly (95+ CSA = 10-12% premium increase). Liability coverage 70% of total insurance costs.
Charging infrastructure dominates electric TCO: depot chargers $60K-80K per unit (8-10 chargers for 50-bus fleet), electrical grid upgrades $1.5M-2M (transformer upgrades, distribution), cable and connection systems $400K. Shared infrastructure reduces per-vehicle cost significantly.
Real-World TCO Scenarios: Impact of Operational Variables
TCO varies significantly based on actual operating conditions; here's how different deployment scenarios change the analysis:
Scenario A: Urban School District (High-Duty Cycle)
Operating Profile: 40,000 miles/year, 60-70% urban driving, frequent stops, older route infrastructure, variable fuel quality
Diesel TCO Impact: +$2.4M (+6.7%) due to 8% lower fuel economy in stop-and-go driving and higher brake/suspension wear. Cost/mile: $6.34/mile vs baseline $5.96/mile.
Hybrid TCO Impact: +$800K (+2.5%) - regenerative braking helps; cost/mile $5.53/mile. WINNER: Hybrid saves $1.6M vs diesel in urban school operation.
Electric TCO Impact: -$1.2M (-3.1%) - electric excels in stop-and-go cycles; energy recovery maximum. Cost/mile: $5.96/mile. Battery degradation acceptable in moderate annual mileage (40K miles = 480K miles @ 12 years, well within typical battery life).
Scenario B: Highway Charter/Tour Operation (Low-Duty Cycle)
Operating Profile: 65,000 miles/year, 85% highway, minimal stops, consistent speeds, long distances between maintenance intervals
Diesel TCO Impact: -$1.2M (-3.4%) due to superior fuel economy on highways (6.2 mpg vs 5.8 mpg urban average) and lower component wear. Cost/mile: $5.74/mile. Diesel advantages maximized.
Hybrid TCO Impact: +$2.1M (+6.5%) - regenerative braking underutilized on highway; cost/mile $6.08/mile. WORST for highway: Hybrid premium not recovered through fuel savings. Hybrid 2.4 mpg advantage not as pronounced at constant highway speeds.
Electric TCO Impact: +$5.8M (+15.2%) - highway range anxiety creates operational complexity; 65,000 annual miles requires frequent charging (problematic for 8-10 hour charter routes); cost/mile $7.28/mile. Battery degradation concern (780K miles @ 12 years exceeds typical 8-10 year battery warranty).
Scenario C: Urban Transit with Subsidy Programs
Operating Profile: 50,000 miles/year, heavy urban cycle, eligible for FTA grants (30-40% capital subsidy), electricity tax credits (electric only)
Diesel TCO Impact (net of subsidies): $21.2M (after 40% capital subsidy). Cost/mile: $3.53/mile. Federal funding dramatically changes the equation.
Hybrid TCO Impact (net of subsidies): $19.4M (after 40% capital + 3% fuel credit). Cost/mile: $3.23/mile. Hybrid remains most economical option.
Electric TCO Impact (net of subsidies): $18.8M (after 45% capital subsidy + $7,500/bus federal tax credit + state incentives). Cost/mile: $3.13/mile. WINNER with subsidies: Electric competitive when grant programs considered. Subsidy sensitivity: federal EV incentives phase out 2027 onward, making current analysis time-sensitive.
Battery Technology & Replacement Cost Impact (Electric Buses)
Battery replacement represents 20-30% of electric bus 12-year TCO; understanding battery lifecycle is critical:
Most manufacturers offer 5-8 year battery warranties (10,000-12,000 operating hours). Protects against manufacturing defects and capacity fade to 80% minimum. Out-of-warranty replacement: $280K-320K per battery pack. Fleet should budget for replacement in year 9-10 of operation (battery typically reaches 75-80% capacity by year 10). Early replacement (year 7-8) if buses operate in extreme temperature climates or with high-duty cycles.
Year 1-5: 3-5% capacity loss total (0.6-1% annually). Year 6-8: 8-12% capacity loss total (3-4% annually). Year 9+: 15-20% capacity loss (accelerating degradation). Typical path: 100% capacity at purchase → 85% at year 8 (still acceptable) → 70% at year 11 (requires replacement for extended range). Hot climates (Arizona, Texas) see 15-20% faster degradation. Cold climates (northern USA) see similar rates but less daily loss. Fleet management: rotate high-degradation batteries to lower-duty routes in later years to extend usable life.
Most fleets replace at 75-80% capacity when daily range becomes limiting (affects route completeness). Some operators tolerate 70% capacity if routes designed around reduced range. Replacement cost (labor + battery + controls): $320K-380K per bus. Consider replacement timing: replacing at year 9-10 aligns with typical fleet refresh cycles. Early retirement of low-capacity battery buses (year 10-11) may be more economical than replacement investment if fleet is nearing retirement anyway.
Industry developing stationary energy storage programs for end-of-life EV batteries (75-80% capacity still viable for grid storage). Companies like Redwood Materials recovering 95%+ of battery materials. Future: second-life battery value may offset 15-25% of replacement costs ($50K-80K per bus by 2028-2030). Current TCO models don't include this benefit; future cost advantage may be significant.
Residual Value & End-of-Life Economics (Years 12+)
Buses don't disappear at year 12; understanding secondary market value impacts net TCO:
$21K-26K per bus (5-6% of $420K purchase). Secondary market exists globally; many diesels exported to developing countries (Mexico, Central America, Africa). Fleet should expect $1.05M-$1.3M proceeds from selling 50-bus diesel fleet after 12 years. Values declining: stricter emissions regulations reduce demand for aging diesels.
$15K-21K per bus (3.1-4.3% of $485K purchase). Secondary market smaller than diesel; hybrid technology less familiar to international buyers. Domestic used market stronger (municipal fleets, NGOs). Fleet should expect $750K-$1.05M proceeds. Values under pressure: accumulating inventory of used hybrids suppresses prices.
$8K-20K per bus (1.5-3.6% of $550K purchase). Secondary market nascent; limited buyer pool (most fleets upgrading to newer batteries rather than buying used). Battery degradation to 60-65% capacity limits usefulness. Salvage value primarily (parts harvesting). Fleet should expect $400K-$1M proceeds depending on battery condition. Improvement expected: as EV bus installed base matures and battery refurbishment technologies improve, secondary market and residual values will increase 30-50% by 2030.
Government Incentives, Grants, and Tax Credits Affecting TCO (2026 Status)
Federal and state programs significantly impact net TCO; programs evolving rapidly in 2026:
up to 80% capital subsidy for replacement/new bus purchases by transit authorities and school districts. No difference between fuel types (diesel/hybrid/electric all eligible). Funding highly competitive; applications require months of lead time. Budget planning assumes 30-50% grant coverage for typical applications.
$40,000 per heavy-duty electric bus (Class 7-8, weight > 14K lbs). Applies to purchase price up to MSRP cap. Phase-out beginning 2027; full credit expires 2032. School districts and public agencies qualify. Estimated impact: 10-15% reduction in electric bus net purchase price compared to diesel baseline.
State-specific incentives vary: California Cap-and-Trade rebates ($30K-50K/bus for emissions reduction), NY EV transition programs, Washington clean bus incentives. Many states phasing out diesel incentives while increasing EV support. Current programs favor electric buses 2:1 vs hybrid over next 2-3 years.
Some utilities offering $15K-25K rebates for EV charging infrastructure deployment (California utilities, Pacific Northwest). Programs encourage fleet transition and reduce grid stress through off-peak charging programs. Rebates reduce charging infrastructure TCO component (infrastructure cost reduced from $3.5M to $2.8M-3.2M potentially).
Federal EV tax credits scheduled to phase down/expire in 2027-2032 depending on battery content and manufacturing location rules. Fleets should accelerate electric bus procurement in 2026 to capture maximum incentives. Future electric bus economics (post-2027) will reflect higher net cost, potentially shifting competitive advantage back to diesel/hybrid.
TCO Sensitivity Analysis: How Changes Affect Your Decision
Understanding which variables most impact TCO helps identify risk factors for your fleet:
Impact on Diesel TCO: +/- $1.26M (from $34.54M to $37.06M). Hybrid impact 37% smaller ($280K swing). Electric impact negligible ($60K swing from electricity volatility). High fuel price sensitivity = favor hybrid/electric. Current forecasts predict 15-20% fuel price increase by 2030.
Impact on Diesel TCO: +/- $840K. Impact on Hybrid: +/- $630K. Impact on Electric: +/- $300K. Technology differentiation most important variable. Electric TCO most stable (fewest moving parts); diesel most sensitive to parts inflation and repair labor costs.
Impact on Diesel TCO: +/- $420K. Impacts all three equally (proportional to loan amount). Higher rates favor leasing vs purchase. Current rate environment (5-6.5%) historically moderate; rates rising 2026-2027 could shift decision toward operation leases.
Impact on Diesel: -1.2M to +2.4M depending on cycle. Highway bias favors diesel; urban bias favors electric. Hybrid least sensitive. Single largest variable affecting choice.
Year 8 replacement: +$400K additional cost vs baseline (year 10 assumption). Year 12+ replacement: -$800K (no replacement during ownership). Battery replacement timing uncertainty = 5-8% TCO range. Critical for fleets retaining buses 12+ years.
Impact on all categories: $5.6M-8.4M potential swing depending on grant/credit realization. Single largest TCO variable. Incentive uncertainty = greatest financial planning risk. Recommend conservative 30% grant assumption vs 50% optimistic scenario.
Bus Fleet TCO Decision Framework: Which Powertrain is Right for You?
Use this decision tree to identify the best powertrain for your specific operational scenario:
Less than 35,000 miles/year: Electric competitive (low annual degradation). 35,000-50,000 miles/year: Hybrid optimal (good balance). More than 60,000 miles/year: Diesel best choice (fuel economy maximized on high-mileage).
80%+ urban (frequent stops): Electric best (regenerative braking). 50-80% urban: Hybrid good choice (balanced). 80%+ highway: Diesel wins (fuel economy, range).
Depot only (no en-route charging): Electric requires 35K-40K daily range = 200+ kWh batteries (expensive, slower charging). Planned infrastructure expansion: Electric viable. No infrastructure plans: Electric not practical; choose diesel/hybrid.
Minimize upfront cost: Diesel (lowest purchase price). Target lowest total cost: Hybrid (7-9% TCO advantage). Maximize grant funding: Electric (45% capital subsidy potential + IRA credits).
Sell/upgrade at year 8-10: Electric or Hybrid (avoid major component overhaul years). Keep 12+ years: Diesel (proven reliability in mature years). Uncertain (depends on funding): Hybrid (fewest regrets across all scenarios).
Recommendation: For most fleets, Hybrid buses represent the best balance of lowest TCO, proven reliability, and minimal operational disruption.
Bus Fleet TCO FAQ: Your Purchasing Questions Answered
Common questions about fleet procurement and TCO analysis:
Typical accuracy ±8-12% depending on assumption stability. Fuel price is single largest variable affecting accuracy (±2% per dollar fuel price change). Historical data: fleets' actual TCO typically within 5-10% of 12-month forward forecast but diverges beyond 5-year horizon. Recommend annual TCO reviews with updated assumptions.
Operating leases (5-7 year terms) typically 5-8% more expensive than purchase but eliminate technology/battery risk. Purchase optimal if: fleet retains buses 12+ years, capital available at 5-6% rates, residual value recovery planned. Lease optimal if: budget uncertainty, rapid technology evolution, or low cash position.
Formal training programs improve fuel economy 8-15%: smooth acceleration, coasting practices, route efficiency. Diesel benefit: $630K-1.05M annual savings potential over fleet (at scale). Electric less affected (no consumption optimization possible). Recommend budget $8K-12K for comprehensive driver training program (3-4% TCO return annually).
Cold climates (Minnesota, Alaska): diesel fuel gels (requires additives), battery efficiency 15-20% lower, heating load increases energy consumption. Hot climates (Arizona, Texas): air conditioning load increases fuel consumption 8-12%, electric battery degradation 15-20% faster. Budget 5-10% TCO adjustment for extreme climates either direction.
Yes, mixed fleets optimal: electric for urban short-range routes, diesel for long-distance charters, hybrid for mixed-duty routes. Complicates maintenance (staff training for three types, parts inventory) and driver familiarity. Recommended minimum fleet size for mixed approach: 30+ vehicles (5+ each type). Small fleets should standardize on single powertrain.
Solid-state batteries (2027-2029) promise 20-30% cost reduction, 50% faster charging, 30% longer lifespan. If realized, electric bus TCO could improve $3M-5M over 12 years. Uncertainty: recommend delaying electric decisions until 2027-2028 if technology costs justify timing risk. Hybrids offer hedge strategy (lower risk, acceptable TCO today).
Used bus market experiencing 3-5% annual price inflation (shortage of used inventory). Parts inflation 4-6% annually (steel, semiconductor costs). Labor inflation 5-7% annually. Effect: TCO cost categories increase approximately 4-5% annually. Project forward from 2026 baseline: 12-year TCO may increase 15-20% from cumulative inflation.
Used buses (4-6 years old) cost 30-40% less upfront but higher maintenance (years 6-12 expensive). TCO calculation: used bus saves $3M-4M upfront but costs $2M-3M more in maintenance years 6-12. Net savings approximately 10-15% over 12-year cycle IF purchased at right age. Risk: technology obsolescence (emission standards, parts availability) greater with used buses.
What Bus Fleet Customers Say About TCO Planning
"We were all set to buy 50 diesel buses until we ran the full TCO analysis. The models showed hybrid would save us $3.4M over 12 years and actually perform better on our urban routes. More importantly, the analysis gave us the data to justify the decision to our board and find the grant funding. We're implementing the hybrid fleet next year. BusCMMS TCO analysis paid for itself in one strategic decision."
— Robert Chang, Fleet Director, Large School District (150 buses, California)
USA-based, professional consulting included







