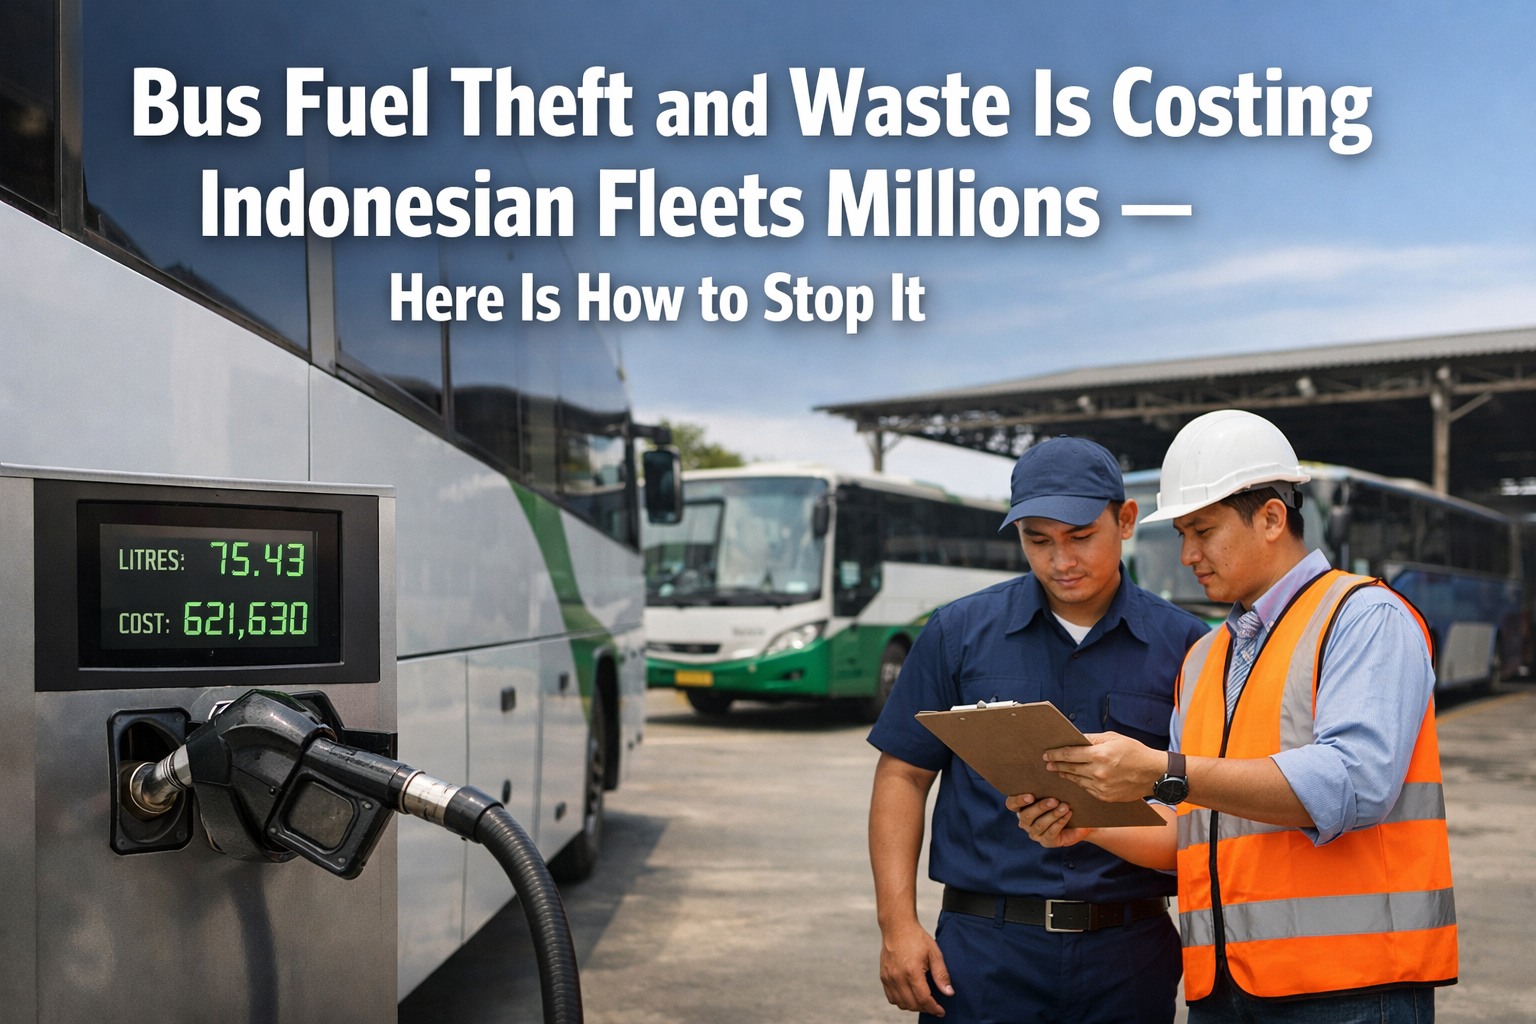
Indonesia ranks among the top countries in Asia for fleet and cargo theft — and bus operators bear the sharpest impact. With diesel at IDR 12,900 per liter and fuel representing 35–45% of total bus operating costs, losses at this scale are not rounding errors. Industry data consistently shows unmonitored Indonesian bus fleets losing 10–20% of their entire fuel budget to a combination of siphoning, receipt fraud, phantom fill-ups, inflated mileage, and undetected idling. Most operators never discover this because the data required to see it does not exist in their operation. This guide breaks down exactly where the money goes, quantifies the loss in IDR at 20, 50, and 100-bus scale, and shows how BusCMMS closes every channel through which fuel disappears. Start your free BusCMMS account and get per-vehicle fuel data from day one.
Where Your Fuel Budget Actually Goes: The Four Loss Channels
Most fleet managers picture fuel theft as someone physically siphoning a tank at night. That does happen — but it accounts for the smallest share. The other three channels operate inside normal daily operations, in broad daylight, and are structurally undetectable without digital tracking.
Drivers submit receipts for more fuel than dispensed. Without cross-referencing fill volume against tank capacity and distance since last fill, this is undetectable. Highest-frequency, highest-value fraud type in Indonesian intercity operations.
Fuel drained directly from tanks at unsecured depots — common on outer routes in Kalimantan, Sulawesi, and Sumatra. Without digital tank-level records, a 20-liter overnight drain shows up only as "higher consumption today."
A diesel bus burns 1.5–3 liters per idle hour. Jakarta traffic, depot waits, and inter-city rest stops add 1–3 idle hours daily. This never surfaces in fuel reports — it inflates per-km consumption with no identifiable cause and gets filed as "route variance."
Drivers report more kilometres than driven to justify higher consumption figures. Without GPS-verified distance cross-referenced against fuel purchases, reported figures are accepted as accurate. Managers approve reimbursements for distance never covered — daily, across the entire fleet.
The IDR Cost at Every Fleet Scale — Conservative Estimates
Assumptions: 200 km average daily distance per bus, 4 km/liter fuel efficiency, IDR 12,900/liter diesel, 25 operating days/month, 15% fuel loss rate (midpoint for unmonitored Indonesian fleets).
| Fleet Size | Monthly Fuel Spend | 15% Monthly Loss | Annual Loss | 3-Year Cumulative Loss |
|---|---|---|---|---|
| 20 Buses | IDR 193.5 juta | IDR 29 juta | IDR 348 juta | IDR 1.04 miliar |
| 50 Buses Most common | IDR 483.75 juta | IDR 72.5 juta | IDR 871 juta | IDR 2.6 miliar |
| 100 Buses | IDR 967.5 juta | IDR 145 juta | IDR 1.74 miliar | IDR 5.22 miliar |
One Bus. One Day. IDR 280,000 Gone — And Nobody Noticed
This is not a worst-case scenario. This is the daily pattern in Indonesian bus fleets running paper-based fuel logs. Walk through a single operational day and watch exactly where the money disappears.
This exact pattern is preventable from the first day of deployment. Create your BusCMMS account and close all four loss channels across your fleet starting today.
How BusCMMS Closes Each Loss Channel — The Exact Mechanism
Generic software logs data. BusCMMS cross-references it — and that difference is where fraud becomes visible and stoppable. Here is what happens for each channel after deployment.
Expert Review: Why Indonesian Fleets Lose More Fuel Than Any Neighbouring Market
The fuel loss problem in Indonesia is not a discipline issue solvable with stricter driver policies. Three structural factors make Indonesian bus fleets uniquely exposed — and understanding them explains why digital tracking delivers faster ROI here than in Singapore, Malaysia, or Thailand.
Conclusion: The Data Exists — Your Fleet Just Does Not Have Access to It Yet
Every bus in your fleet already generates the data needed to detect theft, measure idle waste, and verify mileage. The fuel going into each tank, the kilometres being covered, the hours the engine is running — that information exists. What is missing is a system that captures it digitally, per vehicle, and compares it against what drivers are reporting.
Indonesian bus operators who move from paper-based fuel management to digital tracking consistently discover that somewhere between 10% and 20% of their fuel budget has been leaking through gaps that no spreadsheet was ever designed to catch. The difference between a fleet losing IDR 1 miliar per year to fuel fraud and one that does not is not driver quality — it is whether accountability infrastructure exists at the vehicle level.
BusCMMS closes that gap. Sign up free and generate your first fuel anomaly report within 24 hours of your first operational day. Or if you want to walk through the system against your specific fleet size and routes first, book a fuel compliance walkthrough with our team.
Frequently Asked Questions
How much fuel loss is typical for Indonesian bus fleets without digital tracking?
Industry data for Southeast Asian commercial fleets — and Indonesia specifically, which ranks among the top countries in Asia for fleet theft — indicates unmonitored bus operations lose 10–20% of their total fuel budget. This covers receipt fraud and phantom fill-ups (4–7%), physical siphoning (3–5%), undetected idling (2–5%), and mileage inflation (2–4%). At the 15% midpoint estimate, a 50-bus operator spending IDR 483 juta per month on fuel loses approximately IDR 871 juta per year — money that passes through normal-looking daily fuel reports without triggering any alert in a paper-based system.
What is receipt fraud and why is it so hard to catch without software?
Receipt fraud occurs when drivers submit fuel receipts for purchases that either did not happen or reflect a higher volume than was actually dispensed. For example, a driver fills 45 liters but submits a receipt showing 60 liters, pocketing the IDR 193,500 difference. Without a system that cross-references fill-up volume against the vehicle's tank capacity, the distance covered since the last fill, and the route's expected consumption rate, this transaction is indistinguishable from a legitimate fill-up. It is the highest-frequency, highest-volume form of fuel loss in Indonesian intercity and urban bus operations — occurring on a per-trip, per-day basis across the entire fleet.
How much does engine idling actually cost an Indonesian bus fleet?
A diesel bus burns approximately 1.5–3 liters per idle hour depending on engine size and whether air conditioning is running. In Indonesian operating conditions — Jakarta traffic, Bandung depot waits, inter-city rest stops — buses commonly idle 1–3 hours per operational day. At IDR 12,900 per liter, two idle hours daily burns approximately IDR 51,000–77,000 worth of fuel producing zero passenger kilometres. That is up to IDR 1.9 juta per bus per month in idle waste alone. For a 50-bus fleet, idle waste alone can cost up to IDR 95 juta per month — a cost that is completely invisible in standard daily fuel reports without engine-hour tracking.
Why does Indonesia specifically carry higher fuel loss risk than Singapore or Malaysia?
Three structural factors combine to create elevated risk. First, Indonesia's 17,000-island geography means buses on outer routes in Kalimantan, Sulawesi, and Sumatra fill up at remote stations with zero depot supervision — distance from management equals undetected opportunity. Second, Indonesia's commercial vehicle fleet skews older, and ageing buses have genuinely variable consumption (15–20% vehicle-to-vehicle variance) that provides statistical cover for fraudulent overreporting in paper-based systems. Third, Munich Re's 2024 analysis found that over a quarter of Asian fleet theft incidents involve insider participation, with Indonesia accounting for 14% of total regional fleet theft. These three factors do not exist at the same scale in Singapore or Malaysia — where digital fleet management adoption, shorter routes, and tighter depot oversight reduce structural exposure significantly.
How quickly does BusCMMS recover its cost for an Indonesian bus operator?
For most Indonesian bus operators, BusCMMS recovers its cost within the first month of deployment. A 20-bus fleet losing a conservative 15% of fuel spend recovers approximately IDR 29 juta per month once the loss channels are closed — which typically happens within two to four weeks as drivers recognise that every fill-up is now cross-referenced against vehicle data and GPS records. The software cost is a fraction of that monthly recovery. The longer-term value is clean operational data: accurate route profitability analysis, reliable driver performance scoring, and maintenance forecasting no longer built on inflated consumption numbers — functions that were previously running on corrupted inputs without anyone realising it.







