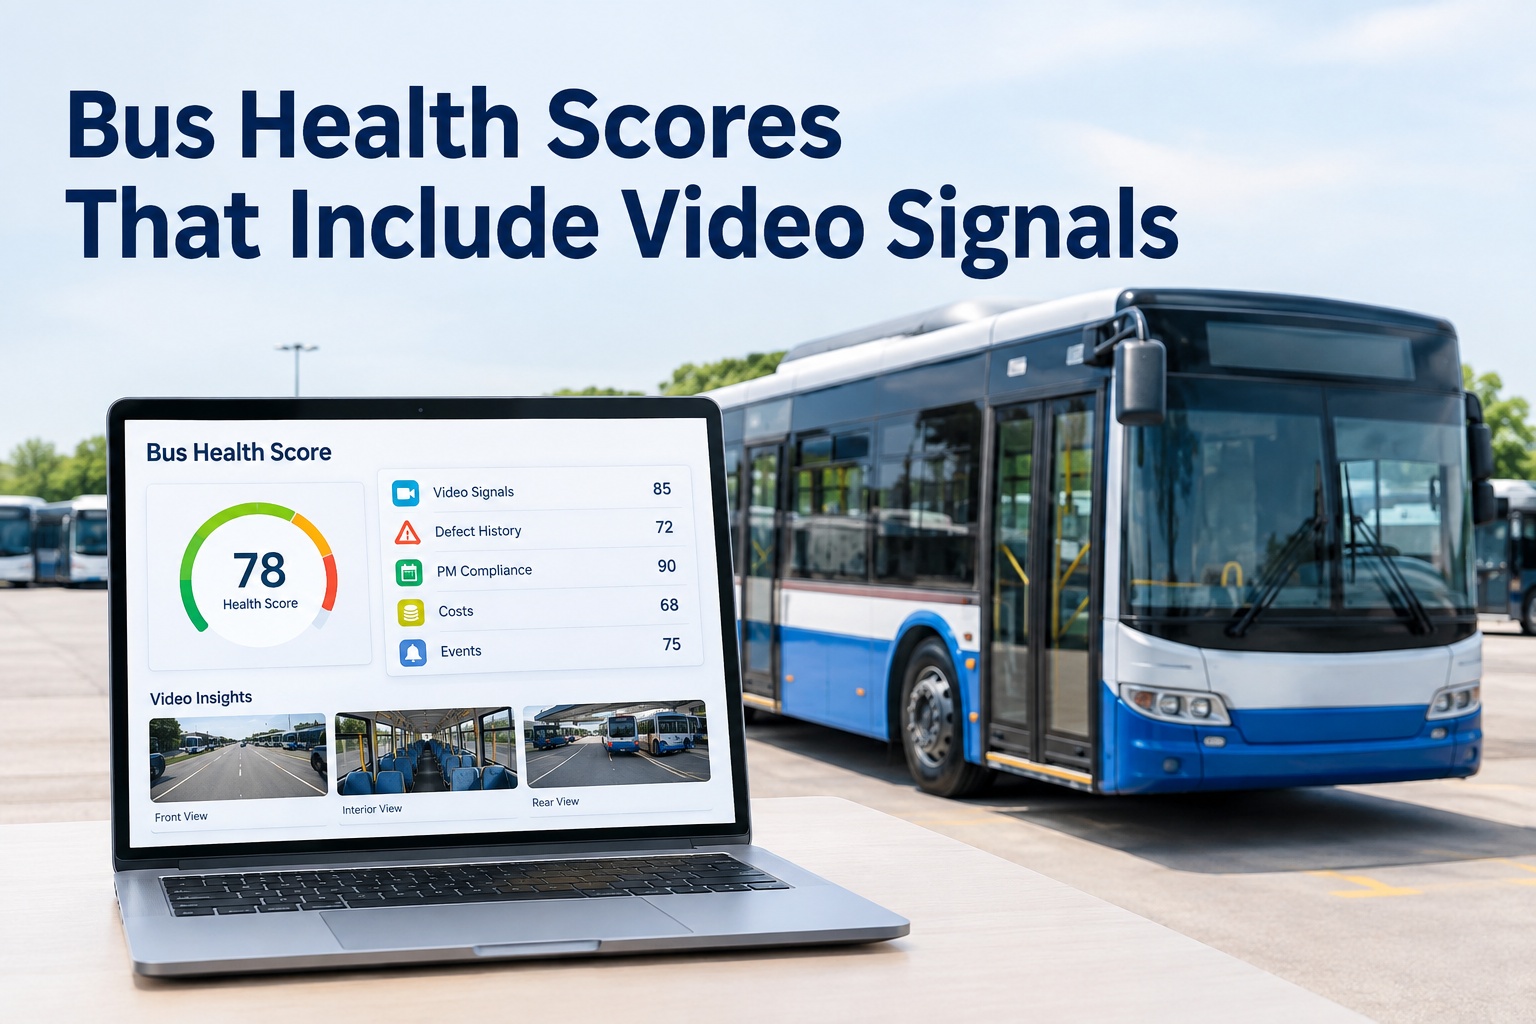
Ask five people on your team which bus in the fleet is the riskiest one right now, and you'll likely get five different answers — one thinking about the bus with the most open work orders, another thinking about the one a driver keeps flagging, another about the one that's due for its annual inspection. A bus health score puts all of that into one number, built from video-detected defects, defect history, PM compliance, repair costs, and safety events — so the riskiest bus in your yard is obvious before it becomes the one stranded on a route.
What Actually Feeds the Score
A single number is only trustworthy if the inputs behind it are transparent. Here's what goes into a composite bus health score and how much weight each signal carries.
Video carries the heaviest weight because it catches what sensors and paperwork miss — a door that hesitates, a driver riding the brake down a grade, a rattle a technician would only hear in person. Sign up to connect your camera feeds and start scoring on real footage.
From Score to Action: The Tier Bands
A number means nothing without a decision attached to it. Every bus health score maps to a tier that tells your dispatcher and maintenance team exactly what to do next — no interpretation required.
Expert Review: How a Score Catches What a Checklist Misses
Here's how a composite score plays out on an actual bus, compared to relying on a paper checklist and driver memory alone.
A paper checklist would have caught this defect on its next scheduled inspection — potentially weeks later. Book a demo to see how much earlier a video-weighted score catches issues like this.
Scores Built on Records That Hold Up Under 49 CFR 396.17 and 396.3
A health score isn't just an internal dashboard number — every input behind it (the defect, the PM interval, the repair, the date) is the same data that 396.3 requires you to retain and 396.17 requires you to prove at inspection. When the score is built from properly logged records, your audit file and your risk dashboard are the same source of truth. Sign up to keep your health scores and compliance records in one system.
The goal isn't a prettier dashboard. It's catching the bus that's quietly sliding toward a breakdown before it costs you a route, a repair bill, or a hard conversation with FTA or FMCSA. Talk to our team about setting up scoring across your fleet and see which of your buses would land in tier C or lower today.
Frequently Asked Questions
What is a bus health score?
A bus health score is a single composite number, typically out of 100, built from weighted signals — video-detected defects, defect and DVIR history, PM compliance, repair cost trends, and safety events. It gives maintenance managers and dispatchers one figure to judge a bus's condition instead of cross-checking five separate systems.
Why does video carry the most weight in the score?
Video catches early signals that sensors and paper checklists typically miss — a brake pull, a hesitant door, unusual driver compensation for a mechanical issue. Because these signs often appear before a fault code triggers or a driver files a DVIR entry, video-detected defects are weighted heaviest in a well-built composite score.
How do tier bands (A through F) work with the score?
Each score range maps to a tier with a clear action: A (Road Ready) clears a bus for full dispatch, B (Monitor) allows dispatch with routine checks, C (Action Required) auto-generates a work order and needs supervisor sign-off, D (Restricted) limits the bus to local routes, and F (Out of Service) locks it from dispatch entirely until repaired and re-inspected.
Does a health score replace the annual 49 CFR 396.17 inspection?
No. The periodic inspection required under 396.17 is a separate regulatory requirement. A health score works alongside it, using the same underlying inspection, defect, and repair records so that both your compliance file and your risk-prioritization dashboard are built from consistent, audit-ready data.
How often does a bus health score update?
On a connected system, the score updates continuously as new signals arrive — a new fault code, a flagged video clip, a completed or missed PM, a new repair cost. This is different from a manual scorecard reviewed monthly or quarterly, which can miss a fast-developing issue entirely.







