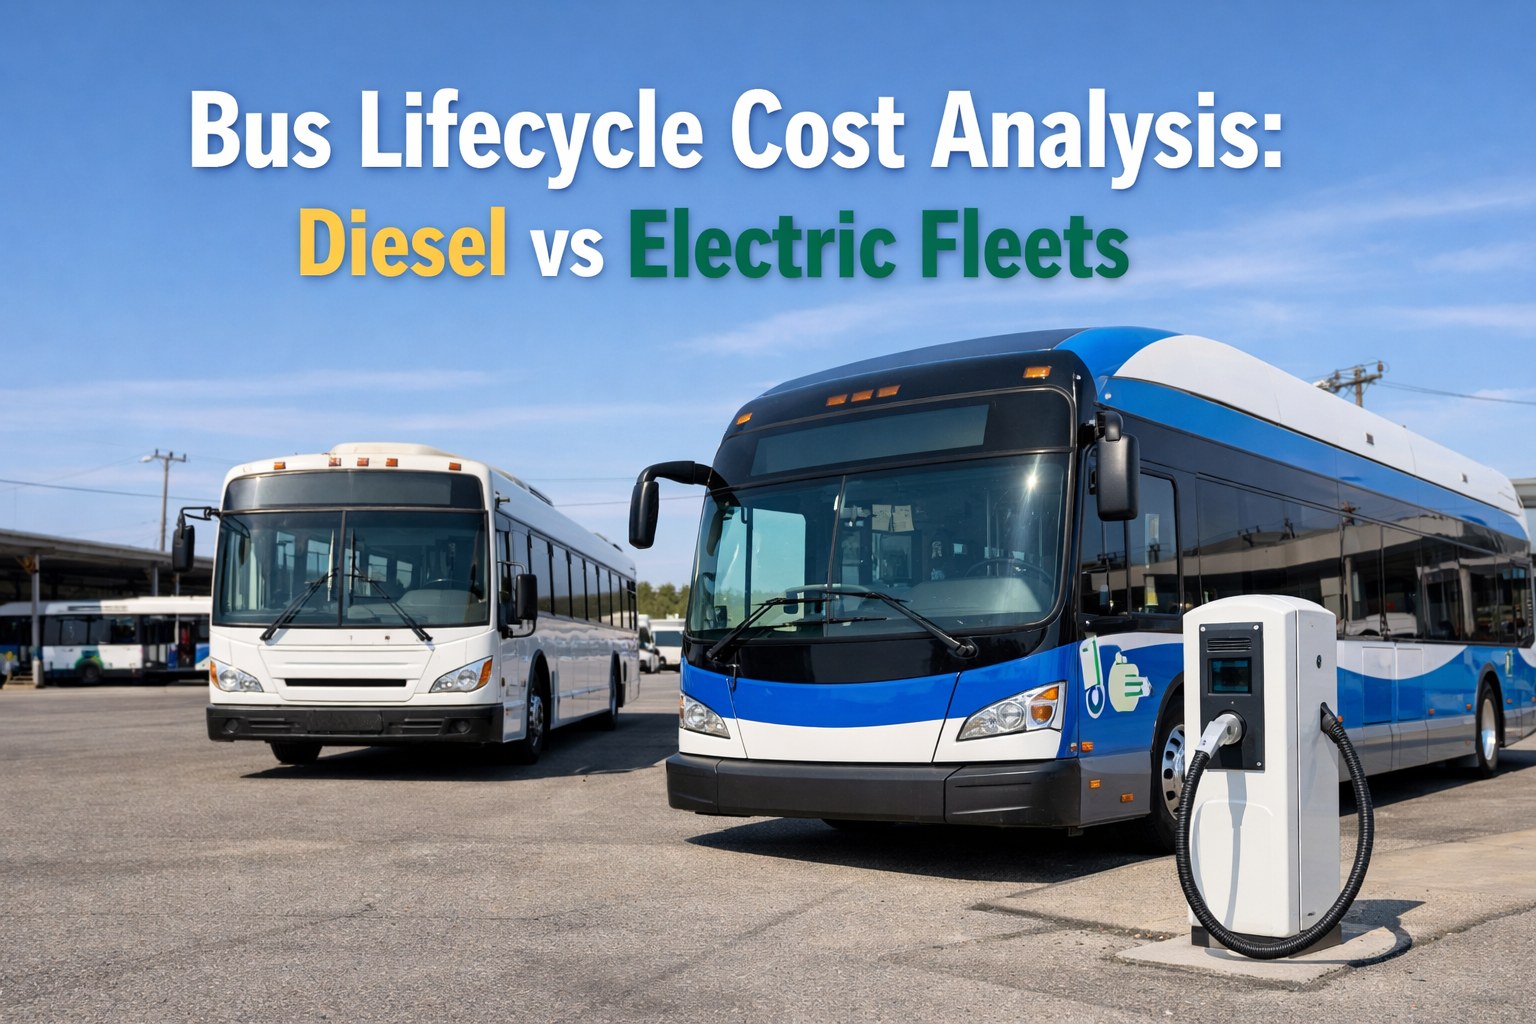
Looking at the sticker price alone could cost your fleet millions. Here's how to calculate what buses really cost over 12-15 years—and how CMMS optimization changes the equation.
Every fleet manager faces the same question: What does a bus actually cost?
The purchase price tells only part of the story. Over a typical 12-15 year service life, fuel, maintenance, downtime, and operational costs often exceed the original investment by 3-4 times. Understanding Total Cost of Ownership (TCO) separates profitable fleets from those bleeding money through inefficiency.
Whether you're evaluating an electric transition, justifying new acquisitions, or optimizing your current fleet—this analysis gives you the numbers that matter.
The Real Cost Picture
Based on industry data: 60,000 miles/year, standard 40-ft transit bus
Diesel Bus
Electric Bus
Why Purchase Price Misleads Fleet Decisions
Electric buses cost 50% more upfront—but that gap reverses dramatically when you factor in operations. Research across European and US fleets shows electric bus TCO running 12-25% lower than diesel equivalents over full service life.
The math is straightforward: maintenance costs run 30-44% lower for EVs, and energy costs approximately 50% less per mile. These operational savings compound year after year, eventually overwhelming the initial premium.
Want to see how these numbers apply to your fleet? Book a demo for a personalized TCO analysis.
The Six Cost Categories That Determine Fleet Economics
Every dollar spent on your fleet falls into one of these buckets. Understanding each component's relative weight helps identify where optimization delivers the biggest returns.
Acquisition Cost
25-35%Purchase price, financing, grants applied
Energy/Fuel
20-30%Diesel, electricity, price volatility
Maintenance
25-40%Parts, labor, scheduled and unscheduled
Infrastructure
5-15%Charging, fueling, facility upgrades
Downtime
8-15%Lost revenue, backup costs, delays
Compliance
3-8%Inspections, certifications, audits
Bus Lifecycle Cost Distribution
Costs don't accumulate evenly. Understanding when major expenses hit helps with budgeting and replacement timing decisions.
Acquisition
Highest capital outlay. Grants can offset 30-50%.
Stable Ops
Lowest per-mile costs. Warranty coverage active.
Major PM
Battery replacement (EV), engine overhauls (diesel).
Evaluation
Repair-vs-replace decisions. Rising cost-per-mile.
Track your fleet's lifecycle costs in real-time. Start your free trial and see where you stand.
How Maintenance Software Changes the TCO Equation
Fleets using modern CMMS report 10-30% reductions in total maintenance costs. Here's where the savings come from.
Track your actual cost-per-mile and identify optimization opportunities
Start Free Trial50-Bus Fleet Annual Savings
CMMS-driven optimization doesn't just reduce costs—it generates predictable, measurable savings that compound across your entire fleet.
A mid-sized fleet implementing proper maintenance tracking typically sees $8,000-$12,000 in monthly savings within the first 90 days.
Diesel vs Electric: What the Numbers Mean for Your Fleet
Diesel Makes Sense When:
- Routes exceed 200+ miles daily
- Infrastructure investment isn't feasible
- Operating in extreme cold climates
- Short ownership period planned (under 5 years)
- Limited access to charging infrastructure
Electric Wins When:
- Routes under 150-200 miles daily
- Planning 10+ year ownership
- Depot charging is feasible
- Grant funding available (can offset 30-50%)
- Fuel price stability is priority
- Environmental compliance required
Not sure which direction fits your fleet? Schedule a consultation for a customized analysis.
Stop Guessing. Start Tracking.
The difference between profitable fleets and struggling ones often comes down to cost visibility. Know exactly what every bus costs—and where to optimize.
No credit card required • Setup in under 10 minutes • Full cost tracking from day one
Frequently Asked Questions
What's included in Total Cost of Ownership calculations?
TCO includes acquisition cost, fuel/energy, scheduled and unscheduled maintenance, infrastructure, insurance, compliance costs, and downtime losses. For electric buses, battery replacement costs (typically at year 6-10) are included. The calculation spans the full expected service life—usually 12-15 years for transit buses.
How much can CMMS actually reduce our maintenance costs?
Research shows fleets implementing CMMS typically achieve 10-30% maintenance cost reduction within the first year. The savings come from fewer emergency repairs (20-30% reduction), optimized parts inventory (15-25% savings), reduced labor overtime (25-35% decrease), and data-driven replacement timing. Most fleets see payback within 4-8 months.
When does an electric bus become cheaper than diesel?
With current pricing, electric buses typically reach TCO parity with diesel around year 5-7, depending on utilization and energy costs. By year 12, electric buses show 15-25% lower total costs. Grant funding can accelerate breakeven to year 3-4 by offsetting the higher purchase price.
How do I calculate cost-per-mile for my specific fleet?
Bus CMMS automatically tracks and calculates cost-per-mile for every vehicle in your fleet. The system captures fuel consumption, maintenance costs, parts usage, and labor hours to generate accurate per-vehicle and fleet-wide metrics. Schedule a demo to see your fleet's data visualized.







