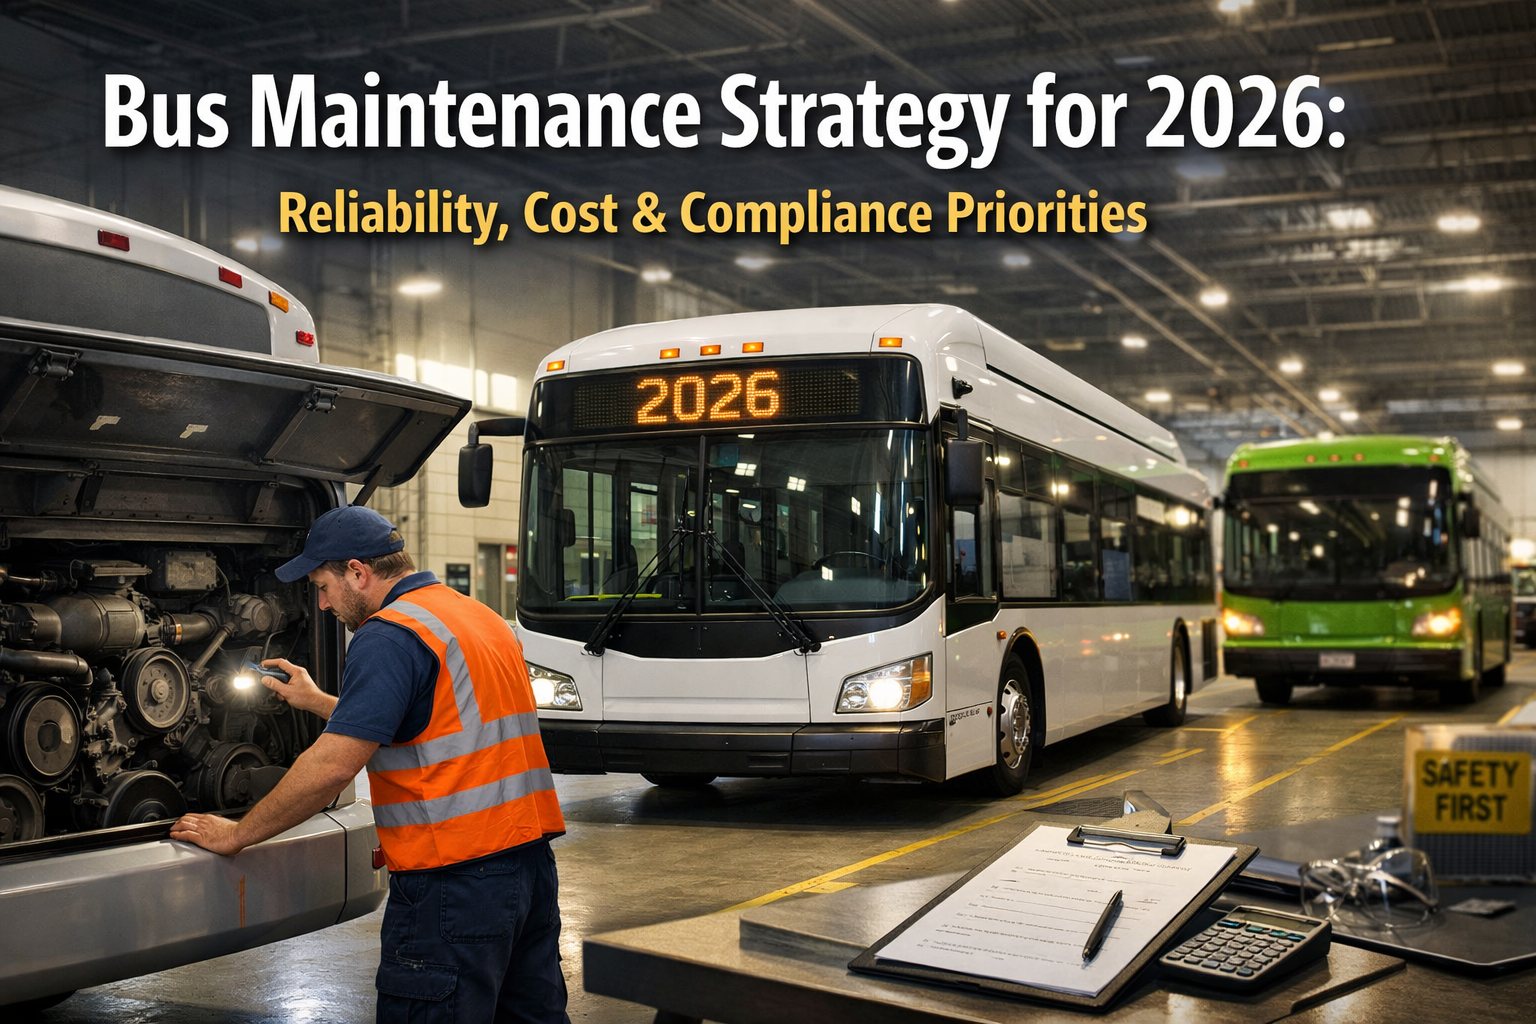
The fundamentals of fleet maintenance haven't changed: keep vehicles running safely and efficiently at the lowest possible cost. But the execution has evolved dramatically. Fleets that achieved 20-30% lower total costs in 2025 did so through strategic investments in predictive maintenance, data-driven decision-making, and proactive compliance management not by cutting corners on parts or deferring service.
For 2026, the stakes are higher. FMCSA's new CSA Safety Measurement System methodology takes full effect in February. Parts costs have increased 15-25% since 2022. Technician labor rates continue climbing 8-15% annually in most markets. And the transition to mixed diesel-electric fleets adds new complexity to maintenance planning.
This strategic guide is designed for transportation executives, fleet directors, and maintenance managers who need to build—or refine—their 2026 maintenance roadmap. We'll cover the key decisions that drive reliability the benchmarks that define cost efficiency, and the compliance requirements that demand attention now.
$0.15-0.25
Cost per mile benchmark for heavy-duty bus maintenance
80/20
Target ratio: planned vs. unplanned maintenance
Feb 2026
FMCSA CSA methodology full enforcement begins
93%+
Target vehicle availability for best-in-class fleets
The 2026 Fleet Maintenance Landscape
Before diving into strategy specifics, executives need to understand the forces shaping fleet maintenance in 2026. Three macro trends are converging to create both challenges and opportunities:
Regulatory Realignment
2026 brings the most significant changes to FMCSA's Safety Measurement System since 2010. "BASICs" become "Compliance Categories" with simplified severity weights and a 12-month violation window. Vehicle Maintenance is being split into two categories under the new CSA scoring system—making inspection performance a direct revenue issue as major shippers increasingly vet carriers based on compliance ratings.
Technology Maturation
Predictive maintenance has moved from experimental to essential. AI-powered diagnostics can now predict failures 14+ days in advance with 55% fewer on-site maintenance requests. Telematics integration enables real-time visibility into engine health, brake wear, and component degradation—transforming maintenance from scheduled intervals to condition-based service.
Cost Pressure Acceleration
Indirect maintenance expenses now add 35-45% to direct parts and labor costs. Downtime costs, administrative overhead, facility expenses, and training investments are often overlooked in budgeting. The most successful operations achieve 20-30% lower total fleet costs by accounting for these hidden expenses and optimizing across the full cost spectrum.
Strategic Priority #1: Reliability as a Revenue Driver
For bus fleets, reliability isn't just an operational metric—it's a revenue driver. Every bus that breaks down mid-route creates cascade effects: missed schedules, passenger complaints, emergency repair costs, and potential contract penalties. In 2026, leading fleets are treating reliability as a strategic investment rather than a maintenance outcome.
Vehicle Availability Target
>93%
Best-in-class fleets maintain 93%+ availability. Below 90% indicates systemic maintenance issues requiring immediate attention.
Mean Time Between Failures
28+ days
Industry leaders have extended MTBF from 4.5 days to 28+ days through predictive maintenance programs.
First-Time Fix Rate
>90%
Target 90%+ first-time fix rate. Comeback rates should stay below 3% to minimize repeat downtime.
PM Compliance Rate
>95%
Preventive maintenance compliance above 95% correlates directly with reduced unplanned breakdowns.
2026 Reliability Strategy: The Predictive Shift
Operations achieving 80-85% planned maintenance typically spend 25-35% less than those with 50-60% reactive maintenance—while also achieving better reliability outcomes. The 2026 strategic imperative is clear: shift your maintenance mix toward condition-based and predictive programs.
Key Actions:
Implement telematics-powered diagnostics to monitor engine health, brake wear, and fluid conditions in real-time
Establish threshold-based alerts that trigger work orders before failures occur
Track MTBF by vehicle, route, and component to identify reliability patterns
Build a continuous improvement loop that refines PM intervals based on actual failure data
Strategic Priority #2: Cost Control Without Cutting Corners
The pressure to reduce maintenance costs is relentless. But fleets that achieve sustainable cost reductions do so through optimization—not by deferring service or downgrading parts quality. Understanding the full cost picture is the first step toward strategic cost control.
2026 Budget Allocation Framework
Based on industry benchmarks and best practices, here's how successful fleets allocate their maintenance budget:
40-50%
Preventive Maintenance
Routine PM, inspections, planned component replacements
25-35%
Repairs & Breakdowns
Unexpected breakdowns, emergency repairs, component failures
10-15%
Major Repairs
Engine rebuilds, transmission replacements, major overhauls
8-12%
Consumables
Fluids, filters, belts, regularly replaced items
3-7%
Compliance
Inspections, certifications, regulatory requirements
5-10%
Reserve
Contingency for unforeseen expenses and market volatility
Cost Per Mile Benchmarks by Fleet Age
Vehicle Age
CPM Range
Strategic Consideration
Years 1-2
$0.03-0.05/mile
Warranty period; focus on documentation
Years 3-5
$0.08-0.12/mile
Wear items begin; PM critical
Years 6-8
$0.15-0.22/mile
Major repairs likely; evaluate replacement
Years 9+
$0.25+/mile
Replace when maintenance >50% of replacement cost annually
Source: Industry benchmarks for heavy-duty commercial vehicles. Actual costs vary by utilization, route conditions, and maintenance practices.
Five Cost Optimization Strategies for 2026
1
Shift to Condition-Based Maintenance
Replace calendar-based intervals with data-driven service triggers. Telematics and sensor data reveal when components actually need attention—extending service life for healthy parts while catching failures early.
2
Optimize Parts Inventory
Target 4-6x annual inventory turnover. Use ABC analysis to prioritize high-value, high-frequency parts. Maintain 90%+ forecast accuracy to eliminate stockouts without excess carrying costs.
3
Maximize Technician Productivity
Best-in-class shops achieve 85-90% wrench time efficiency. Reduce administrative burden, ensure parts availability, and optimize work order scheduling to maximize direct labor hours.
4
Track Hidden Costs
Comprehensive cost tracking reveals that indirect expenses add 35-45% to direct parts and labor. Include downtime costs, administrative overhead, and facility expenses in your true cost calculations.
5
Lifecycle Replacement Timing
Strategic timing of vehicle disposals can improve net lifecycle costs by 10-20%. Monitor market conditions and technology trends that impact resale values. Replace before maintenance costs exceed 50% of annual replacement cost.
Ready to benchmark your fleet's maintenance costs against industry standards? Our experts can analyze your current performance and identify optimization opportunities.
Talk to an ExpertStart Building Your 2026 Roadmap
Strategic Priority #3: 2026 Compliance Readiness
Compliance has evolved from a checkbox exercise to a business-critical function. Rising accident costs, public accountability, and insurance carrier expectations mean documented safety programs supported by data are now mandatory—not optional. The regulatory changes coming in 2026 require proactive preparation.
Critical: February 2026
CSA Safety Measurement System Overhaul
The most significant changes since 2010 take full effect. New compliance categories, consolidated violations, simplified severity weights, and 12-month violation window. Vehicle Maintenance is being split into two categories—making inspection performance directly tied to carrier ratings and shipper selection criteria.
Action Required: Audit current violation history, implement corrective action tracking, and ensure DVIR documentation meets new standards.
February 2026
ELD Device Updates
PSS ELD, Black Bear ELD, and RT ELD Plus removed from approved list as of December 2025—carriers must replace by February 2026. Ensure 6-month data retention capability and proper transfer protocols.
Action Required: Verify all ELDs are on approved list; plan replacement for any affected devices.
Ongoing 2026
DVIR Documentation
FMCSA estimates DVIRs help prevent approximately 14,000 accidents annually through early defect identification. New proposed rules explicitly clarify electronic DVIR compliance—encouraging digital methods that reduce costs while improving documentation quality.
Action Required: Transition to electronic DVIR systems if not already implemented; ensure driver acknowledgment workflows are compliant.
January 2026
Medical Certification Changes
Medical examiners now electronically submit DOT exam results to FMCSA National Registry, which transmits to state DMVs. Paper cards valid only 60 days after issuance.
Action Required: Verify driver medical certifications are properly recorded in DMV systems; update DQ file management processes.
Annual
Periodic Vehicle Inspections
Every commercial vehicle must undergo periodic inspection at least once every 12 months covering all items in 49 CFR 396 Appendix A. Brake systems, coupling devices, exhaust systems, lighting, and steering components all require documented inspection.
Action Required: Schedule annual inspections; maintain documentation accessible for audits.
2026 Compliance Readiness Checklist
□
All ELDs verified on FMCSA approved list
□
Driver Qualification Files complete and current
□
Electronic DVIR system implemented
□
Annual inspection schedule documented
□
Medical certification records verified with DMV
□
CSA score monitoring and improvement plan in place
□
Drug & Alcohol Clearinghouse queries current
□
Maintenance records accessible for compliance review
Technology Investments for 2026
The right technology investments deliver measurable ROI through reduced downtime, lower maintenance costs, and improved compliance. For 2026, these are the high-impact technology priorities for bus fleet maintenance:
Fleet Management Software (CMMS)
ROI: 20-30% cost reduction potential
Centralized maintenance tracking, automated PM scheduling, work order management, and compliance documentation. Most US fleets pay $20-40 per vehicle monthly for mid-range systems—with advanced operations seeing payback within 6-12 months through fuel savings, reduced downtime, and compliance improvements.
Predictive Maintenance & Telematics
ROI: 55% reduction in unplanned repairs
AI-powered fault analysis detects failing components early, predicts remaining vehicle life, and optimizes maintenance scheduling. Leading platforms achieve 14-day advance failure prediction and 73% downtime reduction. Integration with existing telematics provides real-time engine diagnostics and brake monitoring.
Electronic DVIR & Inspection Systems
ROI: Compliance assurance + labor savings
Digital inspection workflows with photo documentation, automated defect routing, and audit-ready records. Reduces paper handling, ensures driver acknowledgment compliance, and creates instant visibility into vehicle condition across the fleet.
Parts Inventory Management
ROI: 35% inventory cost reduction
Automated reordering, demand forecasting, and vendor integration. Target 4-6x annual turnover with less than 2% stockout rate. ABC analysis classifies parts by value and usage frequency for optimized stocking levels.
Building Your 2026 Maintenance Roadmap
Strategy without execution is just planning. Here's a quarterly framework for implementing your 2026 maintenance strategy:
Q1 2026
Foundation & Compliance
Complete CSA compliance audit before February enforcement
Verify all ELDs on approved list; replace if needed
Establish baseline metrics: CPM, availability, MTBF
Finalize annual maintenance budget with contingency
Review and update annual inspection schedules
Q2 2026
Technology Implementation
Deploy or upgrade fleet management software
Implement electronic DVIR if not already in place
Integrate telematics for condition-based maintenance
Train technicians on new systems and workflows
Establish predictive maintenance baselines
Q3 2026
Optimization & Refinement
Analyze Q1-Q2 data; adjust PM intervals based on findings
Optimize parts inventory based on actual usage
Review technician productivity; address bottlenecks
Mid-year budget review; reallocate as needed
Benchmark performance against industry standards
Q4 2026
Assessment & 2027 Planning
Calculate annual TCO and CPM by vehicle
Identify vehicles for replacement based on lifecycle cost
Document lessons learned and best practices
Begin 2027 budget planning with improved data
Set reliability and cost targets for next year
Key Performance Indicators for Executive Oversight
Effective strategic oversight requires tracking the right metrics. These KPIs provide executive-level visibility into maintenance program health:
Cost Per Mile
Target: $0.15-0.22/mile
Total maintenance cost ÷ total miles driven
Vehicle Availability
Target: >93%
Available vehicle-days ÷ total vehicle-days
PM Compliance Rate
Target: >95%
On-time PMs ÷ scheduled PMs
Planned vs Unplanned Ratio
Target: 80:20
Scheduled repairs ÷ total repairs
Mean Time Between Failures
Target: 28+ days
Total operating hours ÷ number of breakdowns
Budget Variance
Target: ±5%
Actual spend vs budgeted spend
Strategic Priorities for 2026
The fleets that will lead in 2026 are those making strategic investments today—in predictive maintenance capabilities, compliance readiness, and data-driven decision-making. The benchmarks are clear: 93%+ availability, 80/20 planned-to-unplanned ratio, $0.15-0.22/mile maintenance costs, and 95%+ PM compliance.
These outcomes aren't achieved through cost-cutting alone. They require the right technology foundation, disciplined execution, and continuous improvement driven by accurate data. The February 2026 CSA enforcement deadline provides a natural forcing function—use it as the catalyst to upgrade your maintenance program before compliance issues become revenue issues.
Build your 2026 roadmap with expert guidance. Our team helps fleet executives implement maintenance strategies that deliver measurable improvements in reliability, cost, and compliance.
Talk to an ExpertGet Started Now
Frequently Asked Questions
Q: What's the ideal maintenance cost per mile for a bus fleet in 2026?
A: For heavy-duty bus fleets, the benchmark range is $0.15-0.25 per mile, depending on fleet age and utilization. Newer vehicles (years 1-2) should be at $0.03-0.05/mile during warranty periods, while older vehicles (years 6-8) typically run $0.15-0.22/mile. When maintenance costs exceed 50% of annual replacement cost, it's time to evaluate vehicle replacement.
Q: What changes to FMCSA compliance should we prepare for in 2026?
A: The most significant change is the CSA Safety Measurement System overhaul taking full effect in February 2026. BASICs become "Compliance Categories" with simplified severity weights and a 12-month violation window. Vehicle Maintenance is being split into two categories. Additionally, several ELD devices were removed from the approved list in December 2025—carriers must replace by February 2026.
Q: What's the target ratio for planned vs. unplanned maintenance?
A: Best-in-class fleets target an 80:20 ratio of planned to unplanned maintenance. Operations achieving 80-85% planned maintenance typically spend 25-35% less than those with 50-60% reactive maintenance—while also achieving better reliability outcomes. This ratio is the single most impactful metric for maintenance program effectiveness.
Q: How should we allocate our 2026 maintenance budget?
A: Recommended allocation: 40-50% for preventive maintenance, 25-35% for repairs and breakdowns, 10-15% for major repairs, 8-12% for consumables, 3-7% for compliance, and 5-10% held in reserve for unforeseen expenses. Budget should account for indirect costs that add 35-45% to direct parts and labor expenses.
Q: What ROI can we expect from predictive maintenance technology?
A: Leading predictive maintenance platforms have demonstrated 55% reduction in on-site maintenance requests, 73% downtime reduction, and 14-day advance failure prediction. Case studies show MTBF improvements from 4.5 days to 28+ days. Most fleets see payback within 6-12 months through reduced emergency repairs, improved parts planning, and better technician utilization.







