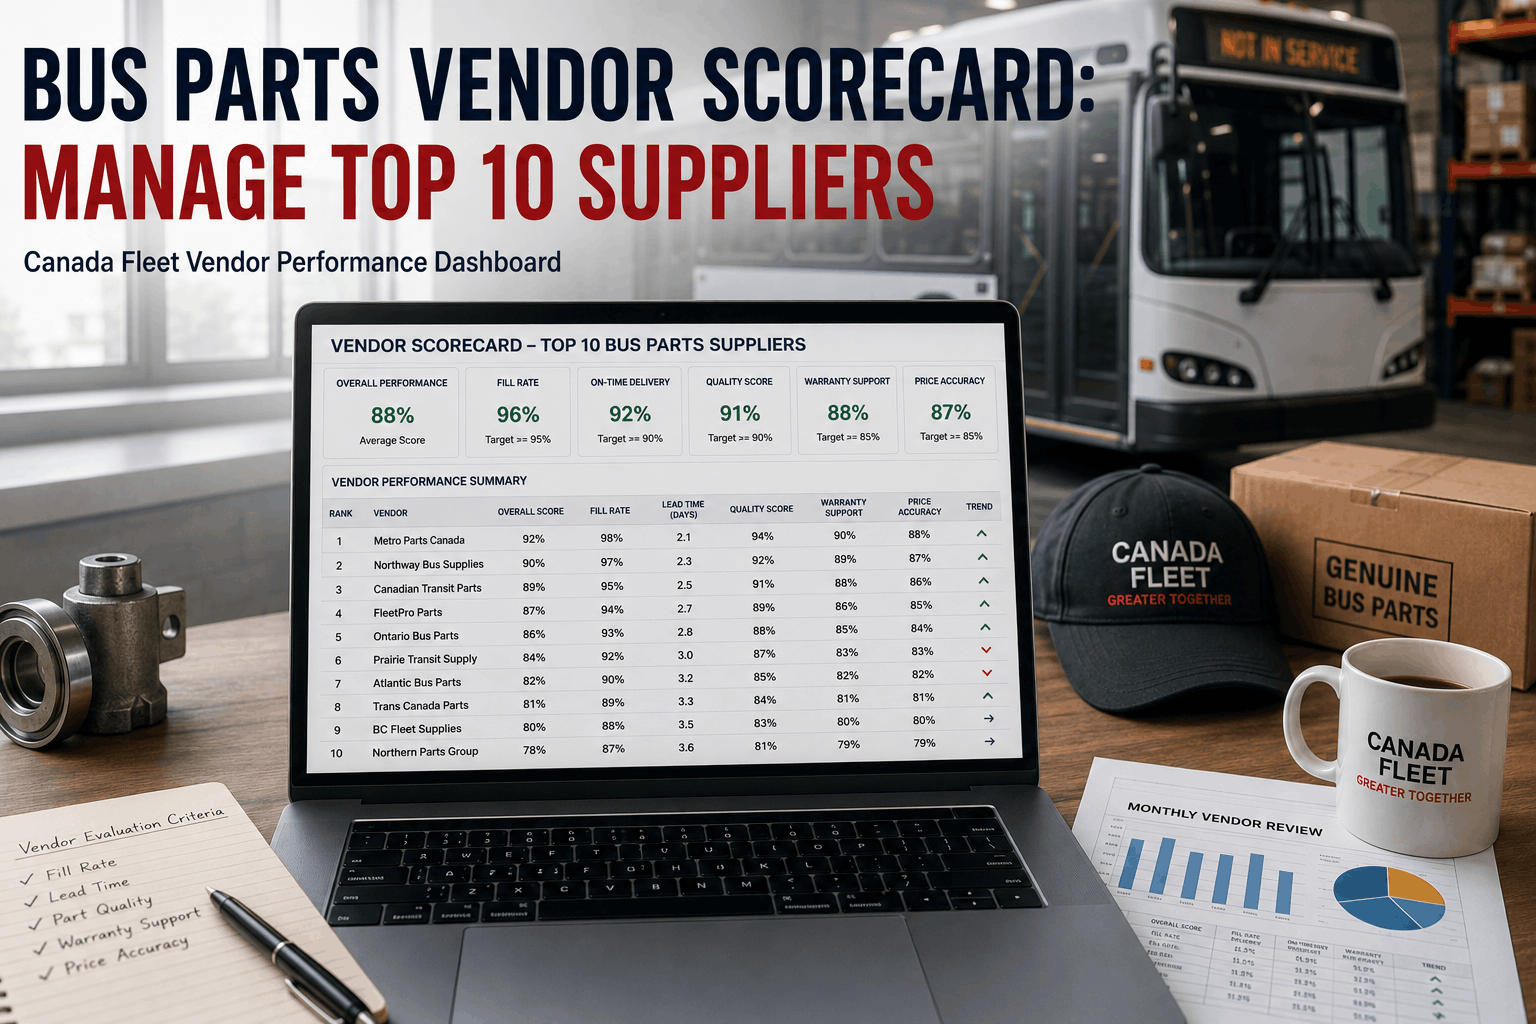
Every U.S. bus fleet depends on a network of parts suppliers ranging from OEM distributors to regional aftermarket vendors to small specialty shops. In most fleets, the top 8-12 suppliers represent 70-85% of all parts procurement spending, yet most fleet managers evaluate vendor performance on intuition, delivery history they can recall, and relationships built over years rather than data. The result is often suboptimal: a vendor with good pricing but poor fill rate or quality issues continues to receive orders because the freight forwarder is friendly; a vendor with excellent lead times and quality is deprioritized because they are not the low-cost supplier; a vendor that is chronically late is kept on the approved list because switching costs are perceived as high. A structured vendor scorecard quantifies vendor performance across five critical dimensions: fill rate (what percentage of orders are fulfilled completely), lead time accuracy, parts quality (defects, returns, DOA rate), warranty and support responsiveness, and price accuracy. This guide covers how to build a vendor scorecard for your fleet's top suppliers, which metrics matter most, how to integrate scorecard data into purchasing decisions in BusCMMS, and how to use vendor performance benchmarking to negotiate better terms and improve overall fleet parts reliability .
Vendor Scorecard System for Top 10 Parts Suppliers
Bus Parts Vendor Scorecard: Manage Top 10 Suppliers
Evaluate fill rate, lead time, quality, warranty support, and pricing for every parts supplier. Scorecard metrics automatically tracked in BusCMMS. Use data to negotiate better terms, prioritize orders, and improve overall fleet parts reliability.
Why Vendor Performance Matters to Fleet Operations
Parts suppliers are not interchangeable commodities. Two suppliers quoting the same brake pad set may have different delivery reliability, quality consistency, and support responsiveness. The vendor with 95% fill rate who delivers on promised dates costs less in total acquisition cost than the vendor with 80% fill rate, even if the second vendor has lower list pricing -- because the 80% fill rate vendor forces you to carry higher safety stock, place rush orders, and sometimes substitute inferior parts when preferred suppliers are out of stock. In fleet maintenance, supplier reliability directly impacts fleet availability. A brake pad set that arrives on-time as promised enables scheduled maintenance that takes a bus out of service for a planned 4-hour maintenance window. The same brake pad set arriving 5 days late forces either extending a repair (costing driver downtime and impacting routes) or substituting a different pad (risking quality issues if the substitute is inferior). The vendor evaluation process in most U.S. bus fleets is informal: purchasing agents know which vendors are "good" based on accumulated experience. The vendor scorecard formalizes this knowledge into data, making vendor decisions comparable, defensible, and optimizable.
The Five Dimensions of Vendor Performance
1. Fill Rate
Percentage of ordered line items the vendor can fulfill completely on the promised date. A 100% fill rate means every order line is fulfilled as promised. A 90% fill rate means 10% of order lines are either partially filled or delayed. Ideal performance: 95-100%. Acceptable performance: 85-95%. Poor performance: below 85%.
Target: 95%+
2. Lead Time Accuracy
How accurately the vendor meets their promised delivery date. If vendor says 5 business days, do they consistently deliver in 5 days, or do they sometimes deliver in 7-8 days? Lead time accuracy is separate from whether the lead time itself is fast or slow. A slow vendor that consistently meets promised dates (on time 95%+ of the time) is more valuable than a fast vendor who misses dates 20% of the time. Metric: percentage of orders delivered on promised date within 1 business day.
Target: 95%+
3. Parts Quality
Defect rate, DOA (dead on arrival) rate, and return rate for parts received from the vendor. Quality metrics include: percentage of orders received with defects, percentage of defective units that require return, and average time-to-failure for parts from this vendor compared to other vendors supplying the same component. Quality should be evaluated separately for OEM vs aftermarket parts from the vendor, as OEM suppliers typically have lower defect rates than aftermarket.
Target: <2% defect rate
4. Warranty & Support
How responsive the vendor is to warranty claims, returns, and support requests. Metric: average time-to-resolution for warranty claims, percentage of warranty claims that are fully resolved (vendor pays for replacement or repair vs customer bears the cost), and availability of technical support for product selection assistance. Good vendors proactively reach out when they learn of potential issues; poor vendors require customers to initiate all warranty claims.
Target: <5 days resolution
5. Price Accuracy
Percentage of invoices that match quoted pricing without unexpected surcharges. Price accuracy includes: freight charges matching estimate, no surprise restocking fees on returns, no hidden minimum order surcharges, and pricing that remains consistent for repeat orders within the same contract period. A vendor with 95% price accuracy may add a $30 fuel surcharge you did not anticipate; a vendor with 100% price accuracy quotes freight and all fees upfront.
Target: 98%+
Composite Score
Overall vendor performance rating combining all five dimensions with weighted emphasis. Most fleets weight fill rate and lead time accuracy highest (40% combined) because these directly impact maintenance scheduling. Quality is weighted 30%, warranty 20%, and price accuracy 10%. A vendor scoring 90%+ on all dimensions is a Tier 1 strategic supplier; 85-90% is Tier 2 approved; below 85% warrants performance improvement plans or vendor replacement.
Target: 90%+
Building Your Vendor Scorecard: Metrics and Data Sources
A vendor scorecard requires data from multiple sources: purchase order records (for pricing and lead time measurement), receiving logs (for fill rate and quality assessment), warranty and return logs (for quality confirmation and warranty response metrics), and direct vendor communication. In manual systems, this data is scattered across spreadsheets, email records, and institutional memory. In BusCMMS, this data is consolidated and automatically calculated. Every time a PO is issued in BusCMMS, the system tags it with the vendor name, promised delivery date, and quoted price. When the order is received, the system records: actual delivery date, quantity received vs ordered, any noted defects or damage on receipt. When parts are installed on a work order, the system links them back to the vendor and the original order. When parts fail prematurely or are returned for warranty, the system logs the return reason and vendor response time. Over 3-6 months of operations, this transaction history generates a complete performance profile for each vendor.
Example: Vendor Performance Scorecard (Sample Data)
| Vendor Name | Fill Rate | Lead Time Accuracy | Quality (Defect %) | Warranty Response | Price Accuracy | Composite Score |
|---|---|---|---|---|---|---|
| Premium Parts Supply | 97% | 96% | 1.2% | 92% | 99% | 95% |
| Regional Distributor A | 88% | 82% | 3.8% | 75% | 91% | 84% |
| Budget Aftermarket Vendor | 79% | 71% | 6.2% | 58% | 85% | 72% |
| OEM Distributor - Local | 95% | 91% | 0.8% | 98% | 100% | 95% |
| Specialty Brake Supplier | 92% | 94% | 1.5% | 96% | 96% | 94% |
Vendor Scorecard Implementation in BusCMMS
Phase 1: Data Setup (Week 1-2)
Create vendor records in BusCMMS for your top 10 parts suppliers. Enter: vendor name, contact information, primary contact, payment terms, and evaluation period (recommend calendar year or fiscal year). Set performance targets for each dimension based on your fleet priorities. Configure automated data collection for all POs, receives, and warranty claims issued through BusCMMS.
Phase 2: Baseline Assessment (Week 2-6)
Manually compile performance data for your top vendors from historical POs and receiving logs for the past 6-12 months. This baseline assessment requires effort upfront but provides the starting point for ongoing tracking. BusCMMS can import historical data in bulk via CSV to accelerate baseline loading. Once baseline is established, all future data is captured automatically as transactions occur.
Phase 3: Monthly Tracking (Ongoing)
BusCMMS automatically calculates vendor scorecards monthly based on transaction data from the prior 30 days. Metrics are updated in real-time as new orders are placed, received, and resolved. Configure dashboards to display vendor performance visually and set automated alerts for vendors that fall below performance thresholds (e.g., fill rate drops below 90%, defect rate exceeds 3%).
Phase 4: Quarterly Review (Every 3 Months)
Conduct formal quarterly vendor performance reviews using the compiled scorecard data. Review trends over the quarter: is the vendor improving, declining, or stable? Identify root causes of any performance gaps (e.g., why did fill rate drop in month 2?). Hold vendor meetings to discuss performance and agree on improvement plans for underperforming metrics. Recognize top-performing vendors and discuss opportunities for deeper partnerships or volume-based pricing improvements.
Phase 5: Purchasing Decisions (Ongoing)
Integrate vendor scorecard data into purchase order routing decisions. BusCMMS can be configured to recommend preferred vendors based on scorecard ratings. For non-emergency parts, prioritize orders to 95%+ rated vendors even if their pricing is slightly higher, because their fill rate and lead time reliability reduce overall procurement risk. For emergency parts, use scorecard data to identify which vendor can deliver fastest with highest quality assurance. Link vendor ratings to performance incentives: consider tiered volume discounts that reward vendors meeting or exceeding performance targets.
Phase 6: Contract Negotiation (Annual)
Use 12-month scorecard data as the basis for annual contract negotiations. Vendors meeting all performance targets are candidates for improved pricing, volume commitments, or expanded part categories. Vendors underperforming targets are placed on performance improvement plans with specific metrics to hit, or may face reduced purchasing volume or replacement. Data-backed contract negotiations are far more effective than opinion-based negotiations because both parties understand exactly what performance is expected and how it will be measured.
Vendor Performance by Supplier Category
OEM Direct Distributors
Examples: Blue Bird, IC Bus, Cummins, Allison direct sales or authorized distributors. Typically highest pricing, highest quality (OEM guaranteed), best warranty support (OEM warranty coverage). Fill rates usually 95%+ for standard parts, longer lead times for custom or low-volume items.
Expected Score: 92-98%
Tier 1 Aftermarket (Premium)
Examples: Wix, Fleetguard, Gates, Bendix, Dorman, Meritor. These suppliers manufacture to OEM specs or supply OEM-level quality under their own brands. Pricing is 20-40% below OEM, quality is nearly equivalent, lead times are competitive. Fill rates typically 90-95%.
Expected Score: 88-94%
Regional Aftermarket Distributors
Regional or national distributors offering house-brand parts at discount pricing. Quality is acceptable for low-risk components (filters, gaskets, hardware), less reliable for critical components. Fill rates vary widely (75-90%). Warranty support is inconsistent, sometimes requiring full return/replacement, sometimes customer expense.
Expected Score: 75-85%
Specialty Suppliers
Vendors specializing in narrow categories: brake components, engine rebuilders, transmission specialists, wheelchair lift providers. These suppliers typically have very high quality and lead time accuracy on their specialty category, but may not stock common maintenance items. Often require advance ordering for specialty parts.
Expected Score: 88-96% (within specialty)
Low-Cost Internet Retailers
Online-only or heavily discounted retailers with minimal physical inventory. Pricing is lowest, but fill rates are typically 60-80%, quality is variable, and warranty support is minimal (often customer responsible for returns/restocking). Not recommended as primary suppliers but useful for occasional commodity items where price is the only criteria.
Expected Score: 65-78%
Vendor Scorecard Dashboard: Visual Performance Tracking
Top 10 Vendor Composite Scores
Vendor Performance Trend (12 Months)
Using Vendor Scorecards in Purchasing Decisions
Vendor scorecards become strategically valuable when purchasing decisions are influenced by scorecard data. A simple rule: for non-emergency parts, always source from vendors rated 90%+ on the composite scorecard, even if their price is 5-10% higher than lower-rated vendors. The reason is that the higher-rated vendor's superior fill rate and lead time accuracy reduce the hidden costs of inventory management, emergency ordering, and parts substitution that the lower-priced vendor creates. For a $50 part from a 85% fill rate vendor, the additional cost of carrying safety stock, making rush orders when the vendor misses, and the occasional need to substitute parts adds $8-15 to the true acquisition cost. The 90%+ fill rate vendor at $52 is more cost-effective at the total cost level.
Vendor scorecards also enable data-backed negotiations. When a vendor's fill rate drops to 88% or defect rate climbs to 4%, the fleet manager has quantitative evidence to trigger a performance discussion rather than anecdotal complaints. Similarly, when a vendor consistently exceeds all targets, the scorecard evidence supports requests for volume discounts or expanded credit terms. Parts Inventory management in BusCMMS integrates vendor scorecards directly into parts sourcing workflows, recommending preferred vendors automatically and alerting managers when orders go to underperforming suppliers.
Vendor Improvement Plans and Performance Recovery
When a vendor's scorecard score drops below target (e.g., from 92% to 87%), the immediate response is to investigate root cause rather than switch suppliers. Sometimes vendor performance dips are temporary -- a supply chain disruption for the vendor, a processing backlog that will clear next month, or a single large order that had fulfillment issues but is now resolved. Other times the performance decline signals a structural problem: vendor is overcommitted and cannot fill orders reliably, vendor's quality control process has deteriorated, or vendor's technical support team has turned over. The vendor scorecard helps the fleet manager distinguish between temporary and structural issues because it shows the trend. If a vendor's fill rate dropped from 95% to 88% in a single month but was trending back up by month 3, the issue was likely temporary. If the fill rate dropped and remained below 90% for 3 consecutive months, there is a structural problem.
When a structural issue is identified, the proper approach is a formal performance improvement plan: clearly communicate the performance gap to the vendor, agree on specific improvement targets (e.g., improve fill rate from 88% to 95% within 90 days), schedule monthly check-ins to track progress, and establish clear consequences if targets are not met (reduction in purchasing volume, replacement with alternative vendor). Many vendors respond positively to structured performance improvement plans because it clarifies expectations and shows that the fleet is serious about accountability. Vendors who cannot or will not commit to improvement plans should be deprioritized in purchasing and eventually replaced.
Data-Driven Vendor Management
BusCMMS automatically tracks fill rate, lead time accuracy, quality, warranty response, and pricing for every parts supplier. Build your vendor scorecard and use performance data to negotiate better terms and improve overall fleet reliability. Free trial includes vendor dashboard setup.
We had five primary parts suppliers and we bought from whoever happened to answer the phone or had inventory at the moment. We switched to BusCMMS vendor scorecards and immediately saw that our biggest vendor by volume had a 78% fill rate while a secondary vendor had 94%. We consolidated more orders to the high-performing vendor and negotiated a 12% volume discount. Within 6 months our emergency parts orders dropped from 8 per month to 2 per month. We actually ended up reducing our parts suppliers from 5 to 3 because the data showed which ones truly performed and which ones we were keeping around out of habit.
FAQ: Vendor Scorecard Implementation
How often should I recalculate vendor scores?
Calculate and review vendor scores monthly in BusCMMS. Monthly calculation provides enough transaction volume (typically 20-50 orders per vendor per month) to yield statistically significant performance data. Conduct formal quarterly vendor review meetings to discuss trends and agree on improvement actions.
What is the minimum transaction volume to generate a meaningful scorecard?
You need at least 15-20 transactions (purchase orders) per vendor per measurement period to generate reliable scorecard data. Smaller transaction volumes produce noisy results. For low-volume specialty suppliers (e.g., wheelchair lift vendors with 2-3 orders per year), track scorecards on an annual basis rather than monthly.
How do I weight the five scorecard dimensions for my fleet priorities?
Default weighting is: fill rate 30%, lead time accuracy 25%, quality 30%, warranty 10%, price accuracy 5%. Adjust weights based on your fleet's priorities. If lead time is most critical (urban transit needing parts within 24 hours), increase lead time weighting to 40%. If quality is paramount (safety-critical brake suppliers), increase quality weighting to 40%.
Can vendor scorecards differentiate between OEM and aftermarket parts quality?
Yes. When you tag parts as OEM or aftermarket during purchasing, the scorecard tracks quality metrics separately. This allows you to hold an OEM supplier to higher quality standards (target <1% defect) while accepting slightly higher defect rates from aftermarket suppliers (target <2.5% defect) that are inherent to the aftermarket category.
How do I incorporate warranty and return handling into the scorecard?
Tag all warranty claims and returns in BusCMMS with the vendor and the resolution type (vendor pays for replacement, customer pays, warranty denied). Scorecard automatically calculates: percentage of warranty claims the vendor honors fully, and average time-to-resolution. Vendors with 95%+ warranty honor rate are rated highly; vendors with 70% or lower honor rates signal quality or relationship issues.
What if a vendor claims my scorecard is unfair because my small order volume skews their metrics?
Valid point for very low-volume scenarios. If you order from Vendor A only 5 times per year, one delayed order (80% on-time performance) may not reflect their true capability. Solution: increase transaction volume by adding part categories or consolidating related purchases; or calculate rolling 12-month scores instead of monthly, providing more data points before measuring performance.
How do I handle vendor score comparison when vendors supply different part categories?
Vendor A supplies filters and fluids, Vendor B supplies brake components -- different categories, different parts. Scorecard data is still comparable because metrics (fill rate, lead time, quality) are category-independent. You can rank all vendors on a composite scorecard, or create category-specific scorecards if you want to evaluate each vendor within their specialty category only.
What is the typical ROI of implementing a vendor scorecard system?
Typical fleet saves $8,000-$15,000 annually on a 40-bus fleet through: consolidating volume to high-performing vendors and negotiating volume discounts ($4,000-$6,000), reducing emergency and rush orders ($3,000-$5,000), and reducing parts scrap due to quality issues ($2,000-$4,000). Setup cost is typically 8-12 hours of staff time. ROI is achieved within the first 6-9 months of implementation.
Conclusion: From Vendor Relationships to Vendor Accountability
Vendor management in most U.S. bus fleet operations is relationship-based: you build trust with a vendor contact, they become your go-to supplier, and the relationship persists even if performance declines because switching is perceived as expensive and disruptive. A vendor scorecard system transforms vendor management from relationship-based to data-based: every vendor's performance is measured against the same criteria, performance is transparent and quantifiable, and purchasing decisions are made based on evidence rather than preference. The result is predictable procurement, lower total acquisition cost, and better fleet availability because high-performing vendors are rewarded with volume while underperformers are given clear improvement targets or replaced. Parts Inventory in BusCMMS automates vendor scorecard calculation, making it practical to track 8-12 suppliers with complete transparency. Start your free trial and set up vendor scorecards for your top three suppliers to see the performance visibility and cost savings potential. Or book a demo with a BusCMMS fleet specialist to discuss vendor management strategy for your specific supplier network.







