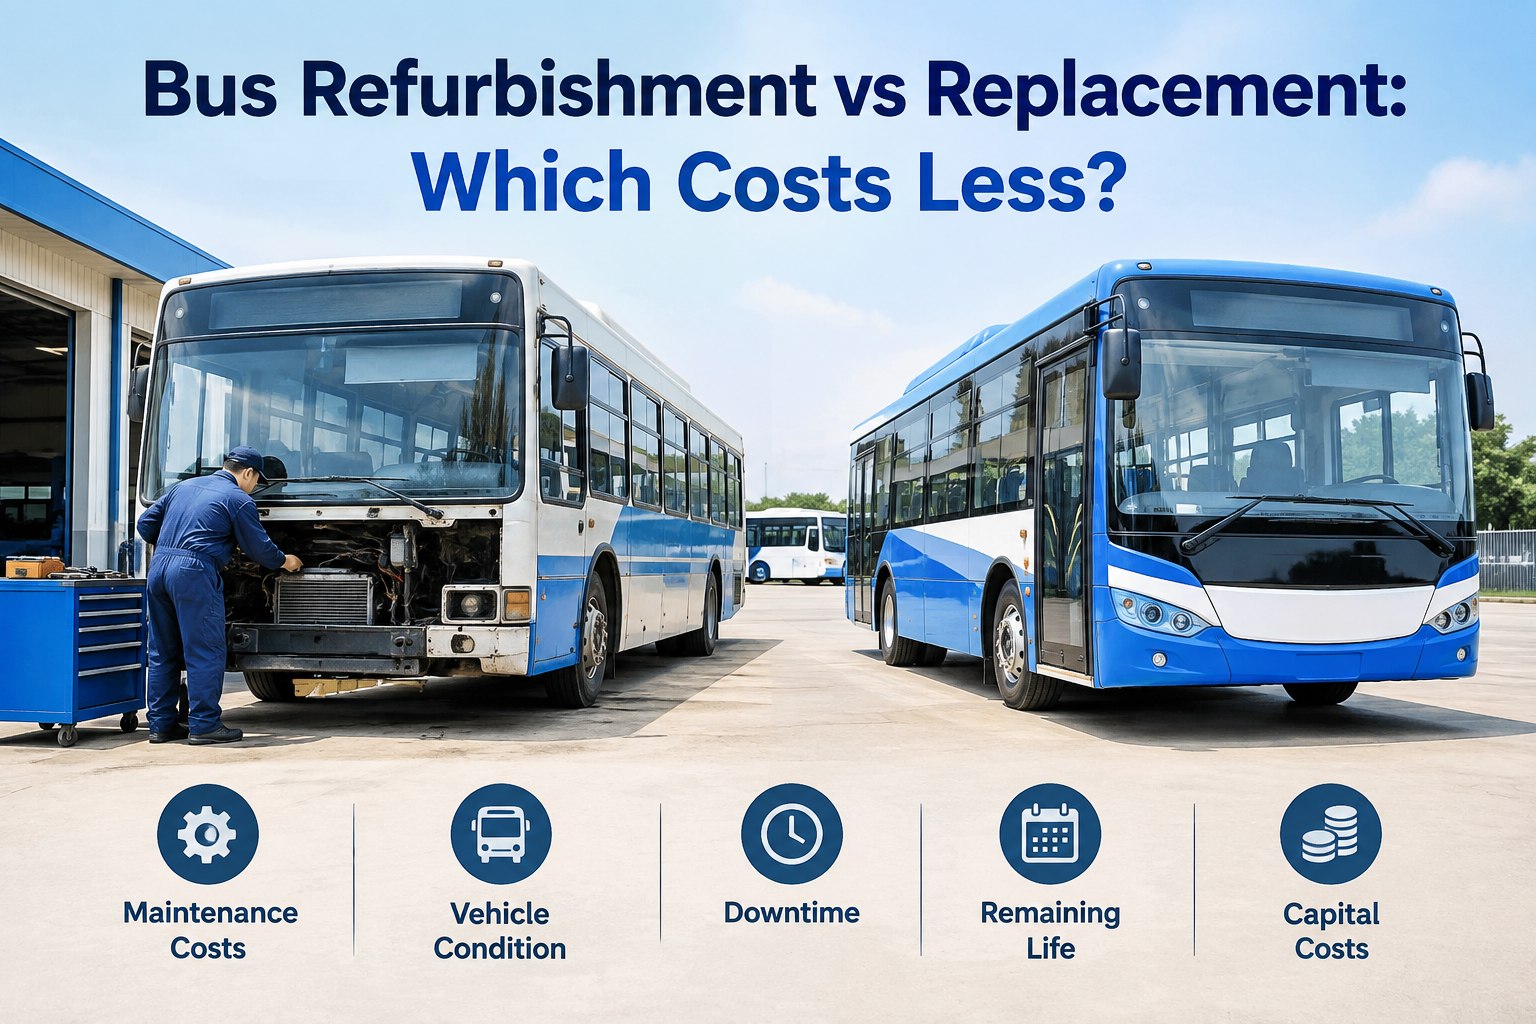
An aging coach hits its midlife point, and the question lands on your desk as a capital decision, not a mechanical one: spend $100K to refurbish, or $350K to replace? The mechanic can tell you the bus is tired. What the board needs is the number that says which choice costs less over the miles it has left. Bus refurbishment vs replacement is a capital-budget decision -- decided on cost per remaining mile, not the age on the title.
Bus Refurbishment vs Replacement: The Capital Decision, by the Numbers
The cost-per-remaining-mile formula, the decision matrix, and how to defend either call in front of a board -- with data, not gut feel.
The right call is per-mile math, not the sticker price
This Is a Capital Decision Wearing a Mechanic's Overalls
The temptation is to treat refurbish vs replace as a shop question -- can this bus be rebuilt? Almost always, yes. The real question is whether it *should* be, and that is a finance question: which option delivers the lower cost per mile over the life it buys?
Framed as capital, the numbers are stark. A midlife overhaul runs roughly $80K to $120K and extends service 5 to 10 years; a new bus runs $300K to $400K for 12 to 15 years. Refurbishment costs about a third and preserves capital -- but only if the bus is a sound enough candidate to earn back the spend.
That is why this decision belongs to finance and directors as much as to the shop. Get it right and you free capital for other buses; get it wrong and you either pour money into a lost cause or scrap a bus with good years left. The whole call rests on per-bus cost data -- exactly what BusCMMS surfaces.
The One Number That Decides It: Cost Per Remaining Mile
Strip away the emotion and the decision comes down to a single comparison. Divide each option's cost by the miles it buys, and the cheaper per-mile option wins. It is the same math for a $100K overhaul and a $350K bus -- only the inputs change.
In that example, refurbishment wins at roughly half the cost per remaining mile -- but that only holds if the frame is sound and the overhaul really delivers those miles. Change the inputs and the answer can flip, which is why you run the number on real data per bus rather than a rule of thumb. You can sign up free and pull each bus's actual cost-per-mile trend to feed this formula.
When to Refurbish, When to Replace
The per-mile math gives you the answer for most buses, but a few hard conditions override it entirely. Structural or frame problems, or a bus already deep past its useful life, take refurbishment off the table no matter how the numbers pencil out. Here is the clean version of the decision.
- Age 8–14 years, 300K–600K miles
- Frame and structure still sound
- Drivetrain rebuildable, not scrap
- Fleet still needs this vehicle class
- Capital budget short of a new equivalent
- 18+ years, past economical rebuild
- Frame corrosion or sagging body
- Drivetrain beyond worthwhile overhaul
- Cost per remaining mile favors new
- Grant-funded new (EV) option available
The 15-to-17-year range is the gray zone -- there the per-mile formula and the structural inspection have to be run case by case, because either answer can be right. What is never right is deciding on calendar age alone: a 13-year bus at $0.55 per mile is a better asset than a 9-year bus at $1.20. You can book a demo to see which of your buses fall in each column.
Why Finance Often Prefers the Refurbishment
Beyond cost per mile, refurbishment carries capital-structure advantages a CFO cares about even when the per-mile numbers are close. It is not just cheaper -- it is easier to fund and gentler on the balance sheet.
Preserves Capital
At roughly a third of new-bus cost, refurbishment frees capital to replace the buses that truly need it -- more fleet renewed per dollar.
Smaller Bond Issues
Lower capital outlay means smaller debt issues, lower interest cost, and cleaner debt ratios for districts that bond-finance fleet.
Faster to Service
An overhaul runs 4–8 weeks in the shop; a new bus is often 6–12 months of procurement and delivery. Refurbishment avoids that gap.
Phases the Capital Plan
Refurbishing some buses now spreads replacement over more years, smoothing the capital curve instead of a one-year spike.
The counterweight is grant funding. When federal or state money -- like Clean School Bus dollars for EVs -- covers much of a new bus, replacement economics can beat refurbishment even at the higher sticker. That is the one case where the sticker price misleads and the net-of-grant number decides. You can sign up free and build the per-bus case for either path.
Your Refurbish-vs-Replace Decision Checklist
Before you take either recommendation to the board, run this list. Each item is a number the decision needs -- and the cost and condition data come straight out of BusCMMS rather than a spreadsheet rebuilt from memory.
- This bus's current cost per mile, trendedBusCMMS cost-per-mile analytics
- Cumulative repair history against valuePer-bus lifecycle cost
- Frame and structural condition confirmedInspection & condition records
- Cost per remaining mile, both optionsAge-vs-cost modeling
- Grant funding checked for the new optionNet-of-grant comparison
- A one-page case, board-ready to exportOne-click lifecycle reports
If you can check all six, the recommendation defends itself -- whichever way it goes. The two hardest to produce by hand, cost per mile and lifecycle history, are the two BusCMMS holds automatically per bus, so the board case is assembled, not guessed. You can book a demo to see the full checklist on your fleet.
How BusCMMS Makes the Decision Defensible
The refurbish-vs-replace call is only as good as the per-bus data behind it -- and that data has to accumulate over years to be trusted. BusCMMS is built for buses and captures it automatically, so when the decision arrives, the numbers already exist. These are the capabilities that back the call.
Per-Bus Lifecycle Cost
Every part, repair, and labor hour tracked against the vehicle -- the cumulative history the whole decision rests on.
Cost-Per-Mile Trends
Per-bus cost per mile over time -- the input to the remaining-mile formula and the signal a bus is nearing the threshold.
Age-vs-Cost Modeling
Ties rising cost to fleet age, so you can project the cost per remaining mile for both refurbish and replace paths.
Condition & Inspection Records
Documented inspection history to support the structural-soundness check that gates every refurbishment.
Fleet-Wide Candidate View
Sorts the whole fleet by cost and age, surfacing which buses are refurbish candidates and which are replace candidates.
Board-Ready Reports
One-click lifecycle analysis and per-mile comparison -- the capital case, formatted for the budget packet.
A midlife overhaul is a big piece of work -- for what it actually includes, engine to HVAC, see our transit bus mid-life overhaul guide. This decision is the layer above it: whether to do that work at all, or replace instead. BusCMMS gives you the numbers for that call. See yours -- book a demo and get a refurbish-vs-replace read on your fleet.
Refurbish or Replace Is a Math Problem, Not a Guess
The sticker prices make replacement look expensive and refurbishment look cheap. The cost per remaining mile tells you which is actually true for a specific bus -- and that is the number a board can be shown, questioned on, and still say yes to.
- Decide on cost per remaining mile, not sticker price
- Let frame condition override the math when needed
- Check grant funding before ruling out replacement
- Run it on real per-bus data, never calendar age
Do that and the refurbish-vs-replace decision stops being a yearly argument and becomes a repeatable calculation -- one where each bus gets the call its own numbers justify, and the capital goes exactly where it does the most good.
Frequently Asked Questions
Is it cheaper to refurbish or replace a bus?
It depends on cost per remaining mile, not sticker price. A midlife overhaul runs roughly $80K to $120K and extends service 5 to 10 years, versus $300K to $400K for a new bus lasting 12 to 15 years -- so refurbishment is about a third of the cost. But the honest comparison divides each option's cost by the miles it buys. Refurbishment often wins at around $0.20–$0.40 per remaining mile against $0.50–$0.70 for new, provided the frame is sound. If structural condition fails, or grant funding heavily offsets a new bus, replacement can be the cheaper or better choice.
How do you calculate whether to refurbish or replace a bus?
Use cost per remaining mile. Divide the refurbishment cost by the miles it is projected to add, and separately divide the new-bus cost by its expected life miles -- the lower per-mile figure is the better financial choice. For example, a $100K overhaul buying 350,000 miles is about $0.29 per mile, while a $350K bus over 600,000 miles is about $0.58. The inputs must come from real per-bus data: current cost-per-mile trend, cumulative repair history, and a confirmed structural inspection. Deciding on calendar age alone is the common mistake -- a 13-year bus at $0.55 per mile can be a better asset than a 9-year bus at $1.20.
When should a bus be refurbished instead of replaced?
Refurbishment usually wins for buses aged 8 to 14 years with 300,000 to 600,000 miles, where the frame and structure are sound, the drivetrain is rebuildable rather than scrap, the fleet still needs that class of vehicle, and the capital budget falls short of a new equivalent. Replacement wins for buses past 18 years, with frame corrosion or a sagging body, a drivetrain beyond economical rebuild, or when the per-mile math favors new -- especially if grant-funded EV options are available. The 15-to-17-year range is a gray zone that needs a case-by-case review of structural condition and funding.
Why do finance teams often prefer refurbishment?
Because it is gentler on capital and the balance sheet. At roughly a third of new-bus cost, refurbishment preserves capital to replace the buses that truly need it, requires smaller bond issues with lower interest and cleaner debt ratios, and returns a bus to service in 4 to 8 weeks versus 6 to 12 months of procurement for a new one. It also lets a district phase its replacement plan over more years rather than absorbing a one-year capital spike. The main exception is grant funding: when federal or state money covers much of a new bus, the net-of-grant cost can make replacement the better call.
How does BusCMMS help with the refurbish-vs-replace decision?
BusCMMS supplies the per-bus data the decision depends on. It tracks lifecycle cost against each vehicle, trends cost per mile over time, and models age against cost so you can project the cost per remaining mile for both the refurbish and replace paths. Documented inspection and condition records support the structural-soundness check that gates any refurbishment, a fleet-wide view sorts buses into refurbish and replace candidates, and one-click board-ready reports package the comparison for the budget packet. Because the numbers accumulate automatically, the capital case is assembled from real records rather than rebuilt from memory when the decision arrives.