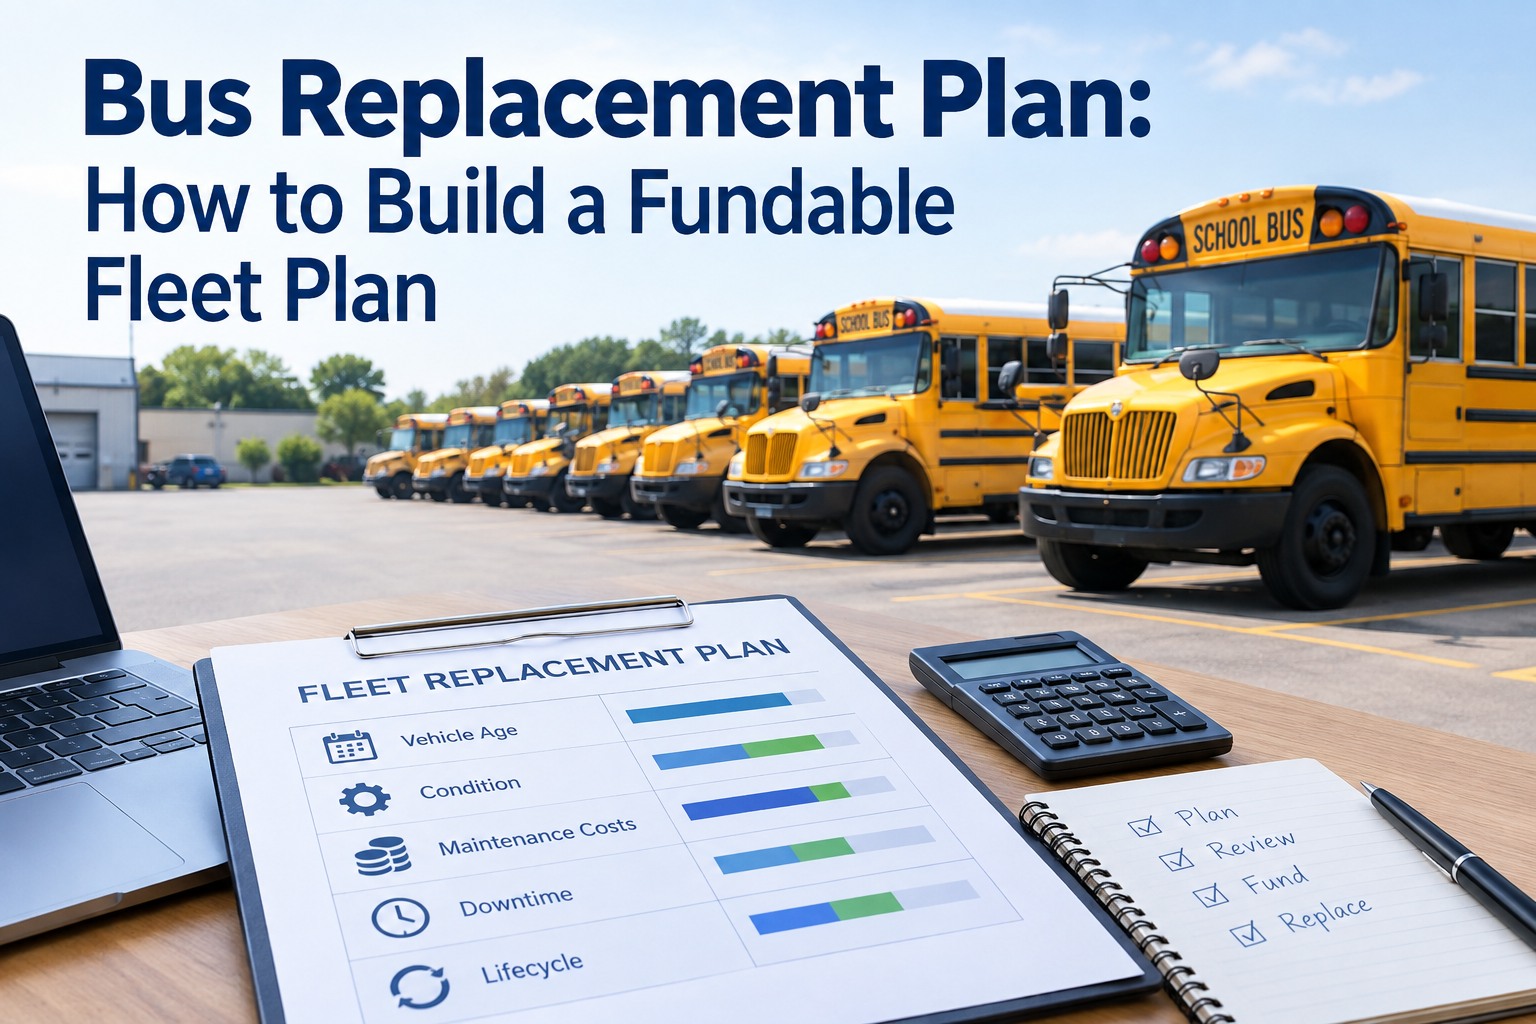
The transmission has been slipping for weeks. You are staring at a $22,000 repair on a bus worth maybe $8,000, and the board meeting is Tuesday. This is how most fleets decide -- reactively, after a failure forces the question, with no data to defend the answer. A real bus replacement plan flips that: a data-backed schedule telling you which buses to replace, when, and why, in numbers a board will approve.
Bus Replacement Plan: How to Build a Fleet Plan the Board Will Fund
The replace triggers, the lifecycle data, and the capital case that turns "we need new buses" into an approved line item.
- CPM runs 130–150% of fleet average
- One repair tops 50% of bus value
- Downtime exceeds 4+ days a month
- Major component (engine/trans) fails
Hit these on data, not on a breakdown
Replacing After the Failure Is the Expensive Way
Most fleets do not have a bus replacement plan -- they have a breakdown that forces one. A bus limps along, invoices pile up, and one day a transmission lets go on a route. Now you are buying under pressure, with no time to shop, no grant window lined up, and no data to justify the spend.
The cost of that reactivity is real. Over a third of U.S. transit vehicles are past their useful life, feeding an $89.8 billion deferred-maintenance backlog -- much of it fleets pouring money into buses long past the point where replacement made sense. Without per-vehicle cost data, every repair authorization is a coin flip.
A planned approach does the opposite. Best practice is to begin planning 24 to 36 months before a bus reaches end of life -- so by the time a unit hits 18 years, you already know its cumulative cost, repair trajectory, and capital timeline. The decision gets made with data, not forced by a breakdown. You can book a demo to see per-bus lifecycle tracking in BusCMMS.
The Four Signals a Bus Has Crossed the Line
A defensible replacement plan does not rely on age alone. It watches four measurable triggers, and when a bus consistently hits one or more, the economics have shifted from "worth maintaining" to "money pit." These are the thresholds that move a bus from your repair list to your replacement list.
Cost Per Mile Spikes
When a bus's all-in CPM runs 130–150% of the fleet average and is trending up, replacement economics almost always favor retirement.
One Repair Too Big
A single repair costing more than 50% of the bus's current value is money thrown at a depreciating asset. Replace instead.
Downtime Piles Up
More than four days out of service per month means the bus is failing your riders and your spare ratio. Reliability has left the building.
A Major Component Goes
Engine or transmission failure on an older bus usually signals the end -- the repair often exceeds what the vehicle is worth.
The power of these triggers is that they are objective. "This bus feels tired" does not survive a budget committee; "this bus runs 145% of fleet-average cost per mile with six downtime days last month" does. The triggers turn a gut feeling into a defensible line on a replacement schedule. Our cost-per-mile guide breaks down how to calculate that first trigger cleanly.
Useful Life Benchmark Is a Guide, Not a Deadline
Every bus type has a useful life benchmark, and a good replacement plan starts there -- but does not stop there. The benchmark tells you when to start planning; the condition data tells you when to actually pull the trigger. Retire on the benchmark alone and you throw away good years.
- School Bus (Type C/D)12–15 yrs
- Transit Bus (40-ft)12–14 yrs / 500K mi
- Well-maintained transitup to 20–25 yrs
The gap between benchmark and real life is where good maintenance pays off
Here is the number that changes budgets: a well-maintained bus regularly runs 14–16 years instead of 10–12, and every year gained is a full replacement cost delayed. On a 60-bus fleet, extending average life by three years can defer $1.8M to $5.4M in capital. That is why the smartest replacement plan is paired with disciplined maintenance. You can sign up free and start building each bus's lifecycle history today.
Building the Replacement Schedule, Step by Step
A replacement plan is not a one-time spreadsheet -- it is a rolling schedule you refresh every cycle as the data moves. Here is the sequence that produces a plan a finance office can build a capital budget around.
The phasing step is where directors win or lose the budget. Replacing ten buses in one year is a shock boards resist; replacing three or four a year on a rolling schedule is a predictable line item that also smooths bond issues and keeps debt ratios clean. A staged plan beats a crisis. You can book a demo to see the schedule build from your own fleet data.
Turning the Plan Into an Approved Budget
A replacement schedule is only half the job. The other half is presenting it so the money gets approved. Boards do not fund "we need new buses" -- they fund a case showing the cost of keeping the old ones is higher than replacing them. Frame it as the numbers below and the vote gets easy.
- A
The Cost of Waiting
Cumulative repair spend and rising CPM on the candidate buses -- what keeping them one more year actually costs.
- B
The Replacement Economics
New-bus CPM vs. the old bus's rising CPM, plus available grant offsets like Clean School Bus funding.
- C
The Phased Timeline
A multi-year schedule that spreads capital predictably instead of asking for one giant number.
- D
The Safety Angle
Aging-fleet reliability and student-safety risk -- the argument no board wants to be on the wrong side of.
This is not theoretical. Using exactly this kind of data-backed lifecycle framework, the LA County Transportation Commission identified $125 million in projected replacement savings by replacing buses on data rather than on failure. The plan paid for itself many times over -- because the numbers, not the gut feeling, made the case. You can sign up free and start assembling your own capital case.
How BusCMMS Builds Your Replacement Plan
A replacement plan is only as good as the per-bus data underneath it -- and that data has to accumulate from day one. BusCMMS is built for buses and captures every cost against the vehicle that generated it, so the plan builds itself over time. These are the capabilities that make it work.
Per-Bus Lifecycle Cost
Every PM, repair, part, and labor hour tracked against the bus from acquisition to disposal -- the base of every decision.
CPM Replacement Alerts
Flags a bus automatically when its cost per mile crosses your set threshold -- the first trigger, caught early.
Useful-Life Tracking
Every bus flagged as it approaches its ULB, so planning starts 24–36 months out, not at the breakdown.
Repair-vs-Replace Analysis
Compares a repair cost to the bus's value and CPM instantly, so every authorization is a decision, not a coin flip.
Downtime Tracking
Days out of service per bus, so the four-day-a-month trigger surfaces before it wrecks your availability.
Board-Ready Exports
One-click lifecycle analysis and phased schedule -- the capital case, formatted for the budget packet.
The point is not to replace buses faster -- it is to replace the right buses at the right time, with a plan you can defend. Fleets tracking per-bus lifecycle cost stop guessing and start planning, and the capital requests that follow get approved because they come with proof. See it on your fleet -- book a demo and get a sample replacement schedule from your data.
A Bus Replacement Plan Is a Budget Tool, Not a Wish List
The fleets that get their buses funded are not the ones with the oldest fleets or the loudest asks -- they are the ones who walk in with data. A replacement plan turns "we need new buses" into a schedule, a cost case, and a timeline the board can say yes to.
- Replace on the four triggers, not on age or a breakdown
- Treat useful life as a planning start, not a deadline
- Phase the buys across years to smooth the budget
- Present the cost of waiting to win the approval
Do that and replacement stops being an annual crisis and becomes a managed cycle -- one where you know which buses go next, what they will cost, and why, with the data to prove it every step of the way.
Frequently Asked Questions
What is a bus replacement plan?
A bus replacement plan is a data-backed, rolling schedule that identifies which buses to replace, when, and why -- based on measurable triggers rather than age or a forced breakdown. It combines per-vehicle lifecycle cost, condition, downtime, and useful-life data to rank replacement candidates, phase purchases across fiscal years and grant windows, and produce a capital case a board can approve. The goal is to move from reactive replacement (buying under pressure after a failure) to strategic capital planning, where every replacement decision is made early, on data, and defended with numbers.
When should you replace a bus instead of repairing it?
Watch four triggers. Replace when a bus's all-in cost per mile runs 130–150% of the fleet average and is trending up; when a single repair costs more than 50% of the vehicle's current value; when downtime exceeds four or more days per month; or when a major component like the engine or transmission fails on an already-aged bus. Any one of these can justify retirement, and two or more make the case clear. The key is tracking them per vehicle so the decision rests on objective thresholds, not on how tired a bus feels.
How long do buses actually last?
Useful life benchmarks put school buses (Type C/D) at roughly 12–15 years and 40-foot transit buses at 12–14 years or about 500,000 miles. But those are planning benchmarks, not hard limits -- a well-maintained transit bus can serve 20–25 years, and well-kept buses regularly run 14–16 years instead of 10–12. Every extra year of service is a full replacement cost deferred, which is why a strong replacement plan is paired with disciplined preventive maintenance. The benchmark tells you when to start planning; the condition and cost data tell you when to actually replace.
How far ahead should you plan bus replacements?
Industry best practice is to begin replacement planning 24 to 36 months before a bus is expected to reach end of life. That lead time lets you line up grant windows (like Clean School Bus funding), phase purchases across fiscal years to smooth the budget, and avoid buying under emergency pressure after a failure. Planning that far out also produces cleaner bond issues with lower interest costs. By the time an aging bus reaches its final years, a good plan already knows its cumulative cost, its projected repair trajectory, and its replacement timeline.
How does BusCMMS help build a bus replacement plan?
BusCMMS captures every cost -- PM, repairs, parts, labor, fuel -- against each bus from acquisition to disposal, building the per-vehicle lifecycle history a replacement plan depends on. It calculates cost per mile automatically and flags a bus when it crosses your replacement threshold, tracks useful-life status so planning starts 24–36 months out, and runs repair-vs-replace analysis by comparing a repair cost against the bus's value and CPM. Downtime tracking surfaces the four-day-a-month trigger, and one-click board-ready exports turn the lifecycle data into a phased schedule and capital case the budget office can act on.