Tires are the #3 maintenance expense in school bus fleets, costing an average of $1,000 per bus annually in replacements alone. Yet most fleet managers track tire condition with spreadsheets, sticky notes, or nothing at all. The result: tires get replaced too early (wasting $200–$400 per tire) or too late (causing $850+ roadside blowouts). Bus CMMS tracks every tire's tread depth, rotation history, and mileage per bus — showing exactly when to rotate versus replace, so you stop guessing and start saving .
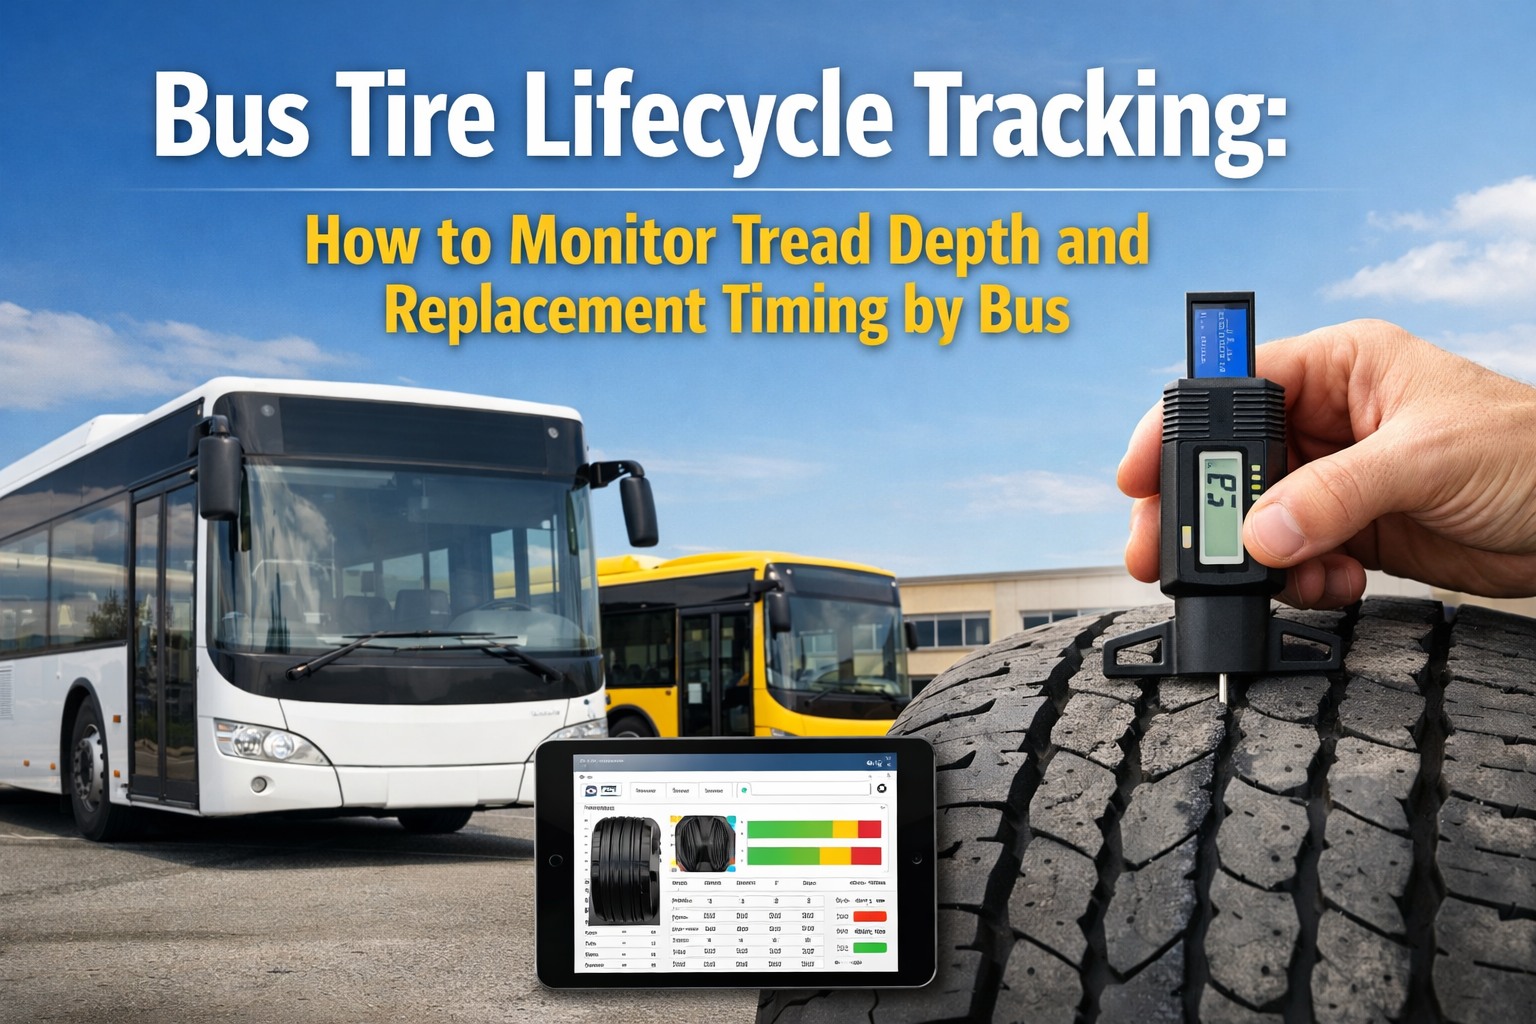
Bus Tire Lifecycle Tracking: How to Monitor Tread Depth and Replacement Timing by Bus
Track every tire from installation to removal — with tread depth, rotation, and cost data per bus
Per-Tire Tracking
Tread Depth Trending
Cost-Per-Mile Analytics
The True Cost of Poor Tire Tracking
Most tire replacements aren't driven by data — they're driven by guesswork. A mechanic eyeballs the tread, a driver reports vibration, or a tire blows out on route. Without per-tire tracking, fleets consistently waste money in four predictable ways:
Early Replacement
$200–$400
Wasted per tire when replaced before end-of-life. Without tread data, shops default to "better safe than sorry."
Roadside Blowout
$850+
Average cost per incident including tow, service call, driver downtime, and schedule disruption.
Missed Rotation
25%
Shorter tire life when rotations are skipped. Missing one rotation cuts 15,000+ miles off tire lifespan.
DOT Violation
$4,200+
Fine for tread below minimum. CVSA's 2025 Roadcheck: 21.4% of vehicle OOS orders were tire-related.
DOT Tread Depth Requirements by Position
Under 49 CFR § 393.75, commercial buses must maintain minimum tread depth or face out-of-service orders. These aren't suggestions — they're enforceable standards that inspectors measure at roadside stops.
Position
DOT Minimum
Replace At
New Tire
Steer (Front)
4/32"
5/32"
10–11/32"
Drive (Rear)
2/32"
4/32"
18–26/32"
Tag/Pusher
2/32"
3/32"
10–11/32"
Best Practice: Replace steer tires at 5/32" and drive tires at 4/32" — catching tires before they become compliance issues or safety risks.
The Tire Lifecycle: From Installation to Removal
Proper tire tracking follows each tire through its complete lifecycle — capturing the data that drives smarter rotation and replacement decisions. Here's what to track at each stage:
1
Installation
Tire brand, model, size
DOT manufacture date
Install date and odometer
Position assigned (LF, RF, etc.)
Purchase cost
2
Ongoing Monitoring
Tread depth (3-point measurement)
Inflation pressure
Wear pattern notes
Photos of condition
Miles since install
3
Rotation
Rotation date and odometer
Old position → new position
Tread depth at rotation
Reason (scheduled/uneven wear)
Technician signature
4
Removal
Total miles achieved
Final tread depth
Removal reason
Retread eligibility
Cost-per-mile calculation
See how BusCMMS tracks every tire lifecycle stage — book a demo
Track Every Tire on Every Bus
BusCMMS logs tread depth, rotation history, and cost per bus. Replacement alerts fire when tires approach thresholds. No more spreadsheets, no more guessing.
When to Rotate vs. Replace: The Decision Matrix
The #1 question in tire management: should this tire rotate or leave the fleet? Here's how to decide based on tread depth, wear pattern, and position:
ROTATE
REPLACE
Recommended Rotation Schedule by Fleet Type
Urban/City Routes
12,000–15,000 mi
Stop-and-go accelerates steer tire wear
Mixed Routes
15,000–20,000 mi
Standard school bus operating pattern
Highway/Charter
20,000–30,000 mi
Consistent speed reduces irregular wear
Wear Patterns: What They Tell You
Irregular wear patterns don't just shorten tire life — they signal underlying vehicle problems. Catching these early prevents the same pattern from destroying replacement tires.
Center Wear
Cause: Chronic overinflation
Fix: Reduce PSI to load specification
Edge Wear
Cause: Chronic underinflation
Fix: Increase PSI, check for slow leaks
One-Side Wear
Cause: Misalignment (camber/toe)
Fix: Alignment check before rotation
Cupping/Scalloping
Cause: Worn shocks/suspension
Fix: Suspension inspection required
Expert Insight: Why Per-Bus Tracking Matters
Fleet Manager Perspective
I managed 85 school buses for a mid-sized district before we started tracking tires digitally. Our "system" was a wall calendar for rotations and mechanics remembering which buses had new tires. The result: we'd replace steer tires with 6/32" of tread left (wasting $300 per tire), miss rotations on half the fleet, and still have roadside blowouts.
The problem isn't that fleet managers don't care about tires. It's that without per-bus tracking, you can't see the patterns. Bus #42 eats through steer tires twice as fast as fleet average — but without data, you'd never know it's an alignment issue. Bus #17's rear tires consistently hit replacement threshold at 45,000 miles while others go 60,000 — but without history, you'd never catch that the driver's route has more stop-and-go.
When we started logging tread depth at every PM service, tire costs dropped 28% in the first year. Not from buying cheaper tires — from catching the buses that needed alignment, rotating at the right time, and replacing tires at actual end-of-life instead of gut feeling. The data paid for itself in three months.
See per-bus tire analytics in action — book a 20-minute demo
What to Track at Every PM Service
Tire tracking happens during routine PM services — no extra appointments needed. Add these data points to your PM-A checklist and tire intelligence builds automatically over time:
Tread Depth: 3-point measurement (inside, center, outside) per tire using calibrated gauge
Inflation Pressure: Cold PSI per position, compared to load specification
Visual Inspection: Sidewall damage, cuts, bulges, cord exposure, dry rot
Wear Pattern: Note any irregular wear (center, edge, one-side, cupping)
DOT Date Code: Flag tires older than 6 years regardless of tread depth
Odometer Reading: Required to calculate miles since install and wear rate
Photo Evidence: Document condition for audit trail and trend analysis
The Bottom Line
Tire costs are controllable — but only with visibility. Fleets that track tread depth, rotation history, and wear patterns per bus consistently cut tire spending by 25–40%. The math is simple: catching tires at actual end-of-life instead of estimated end-of-life saves $200–$400 per tire. Rotating at the right interval extends tire life by 25%. And preventing one roadside blowout saves $850+ in direct costs.
BusCMMS tracks every tire on every bus — from installation through removal. Tread depth gets logged at each PM service. Rotation work orders fire automatically at mileage thresholds. Replacement alerts trigger before tires become compliance issues. And per-bus cost analytics show which buses are burning through tires and why.
Stop tracking tires on spreadsheets. Start building the data that cuts your tire budget by a quarter.
See Tire Tracking Built for Bus Fleets
BusCMMS logs tread depth, rotation history, and cost-per-mile for every tire on every bus. Replacement alerts fire automatically. Wear patterns get documented with photos. Your tire data builds itself.
Frequently Asked Questions
What is the DOT minimum tread depth for school bus tires?
Under 49 CFR § 393.75, steer (front) tires require minimum 4/32" tread depth, and all other tires (drive, tag) require 2/32" minimum. However, best practice is to replace steer tires at 5/32" and drive tires at 4/32" — catching tires before they become compliance issues. Tires below these minimums trigger immediate out-of-service orders at roadside inspections.
How often should school bus tires be rotated?
Most tire specialists recommend rotating tires when half of their tread life is gone, or every 15,000–20,000 miles for typical school bus operations. Urban fleets with stop-and-go routes should rotate more frequently (12,000–15,000 miles). Steer tires should be rotated side-to-side, while drive tires can be rotated front-to-back or in an X pattern. Missing rotation reduces tire lifespan by approximately 25%.
How can I tell if a tire needs rotation or replacement?
Rotate if: tread depth is above replacement threshold but showing uneven wear (2/32"+ difference between positions), reaching 50% of tread life, or 15,000+ miles since last rotation. Replace if: steer tires at 5/32" or below, drive tires at 4/32" or below, sidewall damage, bulges, cord exposure, DOT date code over 6 years, or flat spots from brake/suspension issues.
What causes irregular tire wear patterns?
Center wear indicates overinflation. Edge wear on both sides indicates underinflation. One-side wear indicates misalignment (camber or toe). Cupping or scalloping indicates worn shocks or suspension issues. Flat spots indicate brake problems or skidding. Catching wear patterns early is critical — fix the underlying vehicle issue before rotation, or the pattern will destroy replacement tires too.
How much can tire lifecycle tracking save?
Fleets implementing comprehensive tire tracking consistently reduce tire costs by 25–40%. For a 50-bus fleet spending $50,000 annually on tires, that's $12,500–$20,000 in savings. The ROI comes from: extending tire life through proper rotation (25% improvement), replacing at actual end-of-life instead of early ($200–$400 saved per tire), preventing roadside blowouts ($850+ per incident), and identifying vehicle issues that accelerate wear.