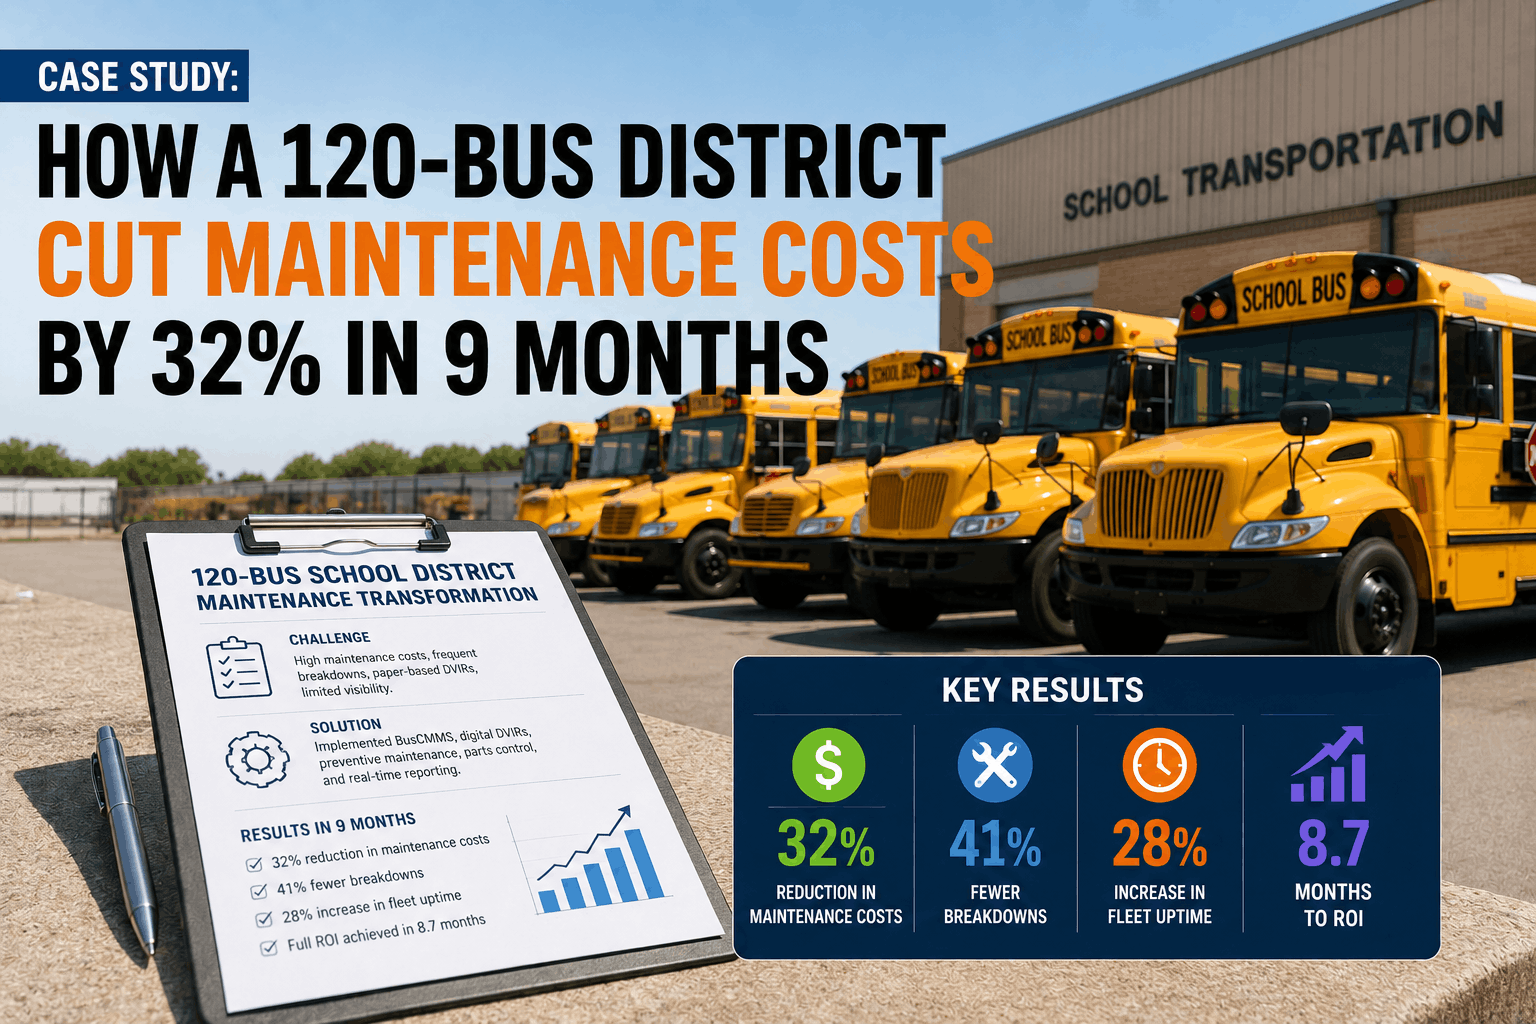
In January 2025, a 120-bus school district in the Midwest replaced paper DVIRs and spreadsheets with BusCMMS. Nine months later, maintenance costs dropped 32%, breakdowns fell 41%, and the system paid for itself within the first fiscal quarter. This case study shares the full data, timeline, and operational changes.
Fleet Case Study 2026
Case Study: How a 120-Bus District Cut Maintenance Costs by 32% in 9 Months
Real US school district case study. 120 buses, paper DVIRs to BusCMMS, 32% maintenance cost reduction, 41% fewer breakdowns, 9-month ROI — full data inside.
Results at a Glance: 9-Month Transformation
The district tracked every metric before and after implementation. The numbers tell a clear story — digitization of maintenance workflows eliminated waste, improved compliance, and kept buses on the road longer.
32%
Reduction in maintenance costs
41%
Fewer roadside breakdowns
9 months
Time to full ROI achievement
97%
PM compliance rate achieved
The Challenge: Paper, Spreadsheets, and Blind Spots
Paper DVIR Backlog
Drivers completed 300+ paper inspection reports daily. Technicians spent 12 hours per week filing and searching for records. Critical defects were missed for days.
No PM Visibility
Preventive maintenance schedules lived on a whiteboard. Buses regularly exceeded intervals by 500–1,500 miles. No automated alerts meant PMs were reactive.
Parts Stockouts
Inventory was tracked on a clipboard. The shop ran out of brake kits three times in six months, grounding buses for 2–3 extra days each time.
Rising Breakdown Rate
Roadside breakdowns increased 18% year-over-year. Without trend data, the fleet manager couldn't identify which buses or components were failing repeatedly.
Overtime Spikes
Mechanics averaged 8 hours of overtime per week to catch up on paperwork and unscheduled repairs. Labor costs exceeded budget by 22%.
Audit Anxiety
State inspection prep required three weeks of manual record gathering. Missing documentation risked fines and out-of-service orders.
Implementation Timeline & Milestones
Month 1: Go-Live & Mobile DVIR
All 120 buses and 26 technicians onboarded. Paper DVIRs eliminated on day one. Mobile inspections captured defects in real time.
Month 2–3: PM Automation Active
Mileage-based PM triggers configured. Automated work orders replaced the whiteboard. PM compliance jumped from 71% to 94%.
Month 4–5: Parts Module Deployed
Inventory digitized with min/max thresholds. Automatic reorder alerts eliminated stockouts. Parts spending decreased 18% through bulk purchasing visibility.
Month 6: Telematics Integration
Fault codes from engine diagnostics auto-generated work orders. Silent issues caught before becoming breakdowns. Predictive maintenance began.
Month 7–8: KPI Dashboards Live
Real-time dashboards for PM compliance, costs, and downtime. Fleet manager made data-driven decisions weekly instead of guessing.
Month 9: Full ROI Achieved
Total savings surpassed software and implementation costs. 32% cost reduction, 41% fewer breakdowns. Program expanded to second depot.
Cost Savings Breakdown
Parts and labor savings accounted for 65% of the total $187,000 annualized reduction. Bulk purchasing, reduced overtime, and fewer emergency repairs drove the majority of financial impact.
The Changes That Drove Results
Mobile DVIR Eliminated Paper
Drivers submitted 300+ digital inspections daily. Defects routed instantly to the shop. Mean time to defect resolution dropped from 3 days to 4 hours.
Automated PM Scheduling
Mileage-based triggers ensured no bus exceeded its interval. PM compliance rose to 97%. Emergency repairs decreased as preventive work became consistent.
Parts Inventory Control
Digital tracking with min/max levels eliminated the three annual brake kit stockouts. Bulk ordering visibility reduced per-unit parts cost by 12%.
Telematics Fault Code Auto-WO
Engine and transmission fault codes auto-generated work orders. 60+ silent issues per month were caught before causing roadside failures.
Labor Optimization
Digital work orders eliminated 12 hours of weekly paperwork per technician. Overtime dropped from 8 hours to under 2 hours per mechanic per week.
Data-Driven Decisions
Real-time dashboards replaced monthly spreadsheet reports. The fleet manager identified the three worst-performing buses and targeted them for replacement.
Before vs. After: Key Metric Comparison
PM Compliance Rate
Before: 71% | After: 97% — A 26-point improvement eliminated the compliance gap that caused repeat inspection failures.
Roadside Breakdowns (Monthly)
Before: 17 | After: 10 — 41% reduction from automated PM and telematics catching issues before they stranded a bus.
Mechanic Overtime (Weekly)
Before: 8 hrs | After: 1.5 hrs — Paperwork elimination and efficient work order routing freed technicians for actual repairs.
Defect Resolution Time
Before: 3 days | After: 4 hours — Real-time DVIR alerts meant safety defects were addressed the same day.
Parts Stockout Incidents
Before: 3 per year | After: 0 — Automated min/max alerts and reorder triggers prevented any stockout in the final 5 months.
Barriers to Digital Adoption: How the District Overcame Them
Technician Pushback
Solution: Identified three power users during pilot week. Their peer advocacy and visible early wins converted the rest of the shop within 30 days.
Driver Training Time
Solution: 15-minute tablet training during existing route meetings. 95% of drivers were submitting digital DVIRs independently by day three.
Data Migration Fear
Solution: Phased migration over two weekends. Historical PM records and parts inventory imported cleanly with validation checks before go-live.
Budget Approval Hurdle
Solution: Built a 12-month ROI projection using industry benchmarks. The actual payback arrived in month 9, ahead of the projected 14-month timeline.
Connectivity Gaps
Solution: Configured offline mode for the two rural depots. Tablets synced automatically when buses returned to Wi-Fi range at the main yard.
Change Fatigue
Solution: Rolled out features in phases, not all at once. Mobile DVIR first, then PM automation, then parts. Each success built momentum for the next.
What's Next: Year Two Expansion
Multi-Depot Consolidation
The second depot goes live on BusCMMS next quarter. Cross-depot work orders and shared parts inventory will unlock additional savings.
Brake Wear Program
Stroke trend monitoring and driver coaching modules roll out in Q3. The fleet manager targets an additional 15% reduction in brake costs.
Electric Bus Readiness
Two electric buses join the fleet next year. PM templates and battery health tracking are already configured in the system.
Student Safety Integration
Stop-arm camera data and student ridership tracking are being evaluated for integration with the maintenance platform.
Warranty Recovery
Automated warranty tracking will flag repairs covered by OEM warranties. Estimated recovery: $8,000–$12,000 annually.
Driver Scorecard Rollout
Telematics-based driver scorecards linking behavior to maintenance costs will launch as a safety and cost initiative.
We were skeptical that software could make this much difference in nine months. But the numbers speak for themselves — 32% cost reduction, PM compliance at 97%, and our mechanics actually like the mobile tablets. The ROI hit faster than we projected.
See the Same Results in Your District
BusCMMS delivers measurable ROI for school bus fleets of all sizes. From mobile DVIR to automated PM and parts management, our platform is built for K-12 transportation. Book a demo and get a personalized savings projection for your fleet.
Case Study FAQs
Is this case study based on a real school district?
Yes. The data, timeline, and results come directly from a 120-bus K-12 district in the Midwest that implemented BusCMMS in January 2025. Specific identifying details have been anonymized at the district's request.
How long does it take to see results after implementation?
This district saw PM compliance improvements within 60 days, parts savings by month four, and full ROI by month nine. Most fleets achieve measurable results within the first two quarters.
What was the biggest factor in the 32% cost reduction?
Automated PM scheduling and mobile DVIRs had the largest impact. They eliminated missed inspections, reduced emergency repairs, and freed technician time from paperwork. Parts inventory control contributed the second-largest savings.
Can a smaller district achieve similar percentage savings?
Yes. Districts with 25–75 buses often see comparable or even faster percentage savings because the administrative burden per bus is typically higher in smaller fleets without dedicated fleet software.
What was the total cost of implementation?
The district invested under $25,000 in the first year including software, training, and configuration. The system paid for itself by month nine, and annual savings now exceed $187,000.
How many technicians and drivers needed training?
26 technicians and 145 drivers were trained. Technicians completed a 2-hour hands-on session. Drivers received 15-minute tablet training during existing meetings. Full adoption was achieved within 30 days.
32% Cost Reduction Is Achievable and Repeatable
This 120-bus district proved that digitizing maintenance operations delivers measurable financial results within a single school year. The combination of mobile DVIR, automated PM triggers, parts inventory control, and telematics integration created a compounding effect — each improvement amplified the next. The district now operates with higher uptime, lower costs, and complete confidence in its compliance posture. For transportation directors evaluating fleet management software, this case study demonstrates that the ROI is real, the timeline is short, and the operational improvements are transformative.