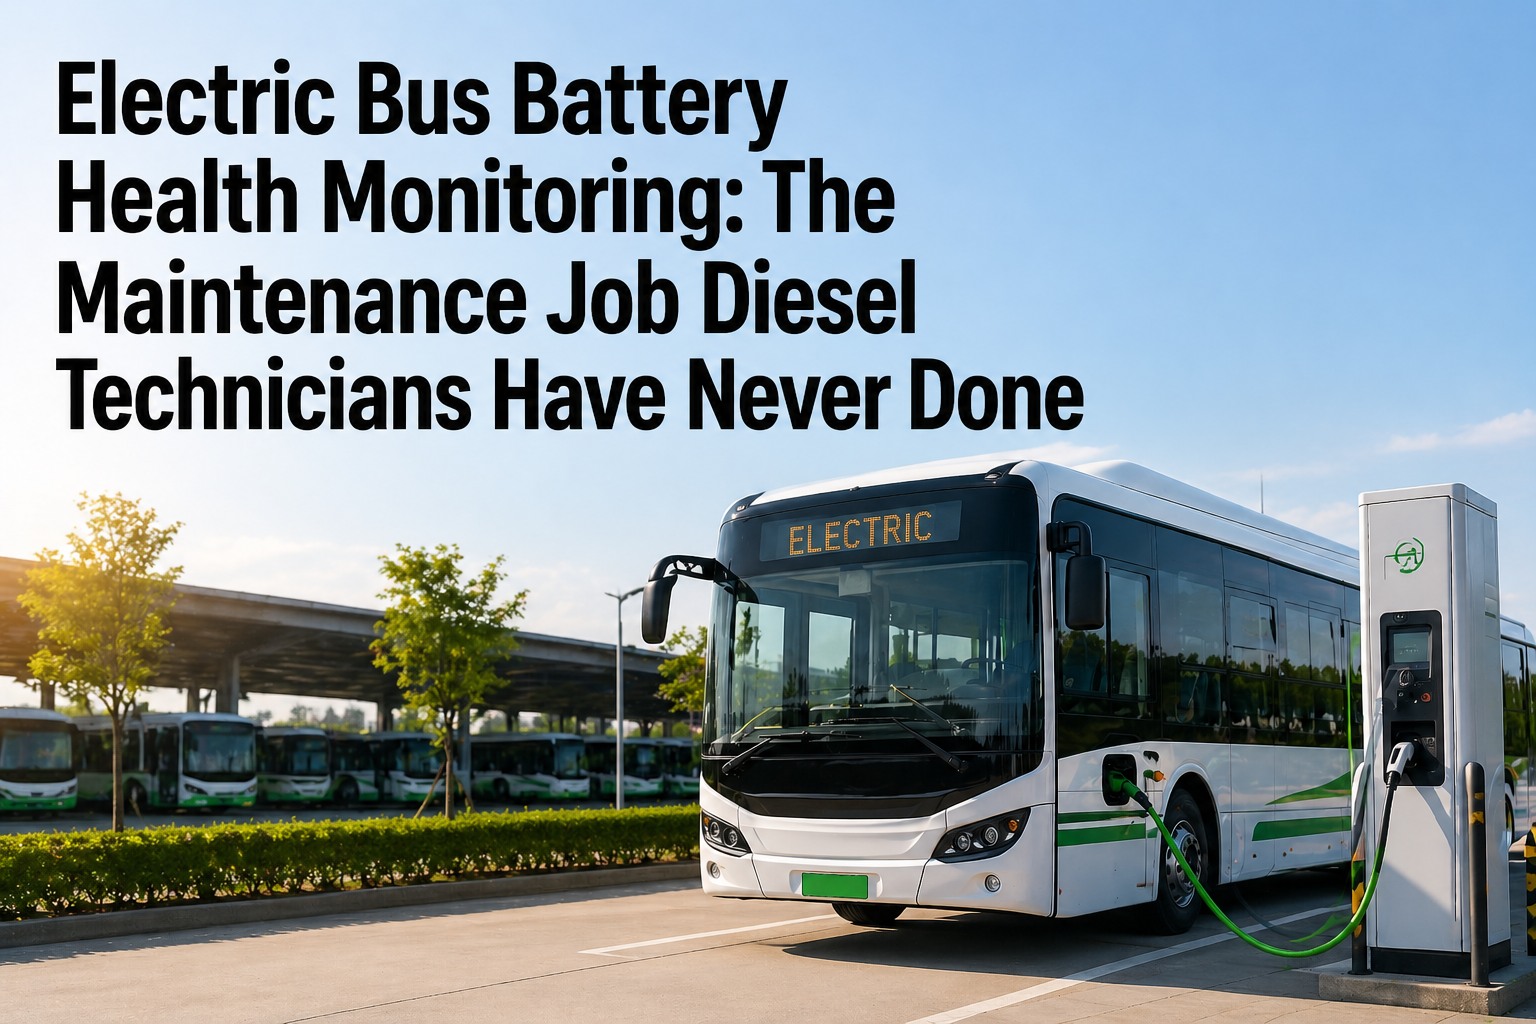
Your diesel technicians can rebuild a DT466 blindfolded. They can chase down a turbo leak by sound alone. But hand them a 155 kWh lithium-ion battery pack throwing a voltage imbalance fault — and they're staring at a $160,000 component they were never trained to diagnose. Electric buses are arriving in school districts across America, and battery health monitoring isn't optional — it's the single most expensive maintenance job your shop has never done.
Electric Bus Battery Health Monitoring: The Maintenance Job Diesel Technicians Have Never Done
Battery degradation kills range and resale value. Here's how to track SOH, manage charge cycles, and schedule proactive maintenance before your fleet pays the price.
2.3% Avg Annual Degradation
$50K–$85K Replacement Cost
12–15 Year Battery Life
State of Health (SOH): The New "Engine Compression Test" for EV Buses
In diesel world, you measure engine health with compression tests, oil analysis, and blowby readings. In the EV world, there's one number that tells you everything: State of Health (SOH). It's the percentage of usable battery capacity remaining compared to when the pack was new.
SOH = (Current Maximum Capacity / Original Maximum Capacity) × 100. A new battery starts at 100% SOH. Industry standard considers 80% SOH the end-of-life threshold for transit and school bus use — below that, range loss becomes operationally disruptive. Most OEMs warranty to 70% capacity over 8–12 years.
Here's the critical detail most fleet managers miss: the SOH your BMS displays on-screen is not always accurate. Manufacturers use proprietary algorithms, and some lock SOH at 100% for months to mask an initial capacity buffer burn-off. Independent monitoring through your CMMS — cross-referencing actual energy throughput against stated capacity — gives you the real picture.
SOH vs. SOC: Don't Confuse the Fuel Gauge With the Engine Health
The most common mistake new EV fleet managers make is confusing State of Charge (SOC) with State of Health (SOH). They sound similar. They're completely different — and mixing them up leads to missed warranty claims, surprise range loss, and buses that can't finish afternoon routes.
SOC (State of Charge)
SOH (State of Health)
Diesel Equivalent
Fuel gauge
Engine health / compression
What It Measures
Energy remaining right now
Total capacity vs. original
Changes
Every charge/discharge cycle
Gradually over months/years
Ideal Range
20%–80% daily operating
Above 80% for operational use
Who Needs It
Drivers and dispatchers
Fleet managers and maintenance
Think of it this way: SOC tells your driver "you have 65 miles of range left today." SOH tells your fleet manager "this bus will only have 102 miles of total range by next September — down from 138 when it was new." One is a daily readout. The other determines your capital replacement schedule.
Start tracking SOH and SOC across your EV fleet in one dashboard
The 5 Battery Killers: What Accelerates Degradation in School Bus Fleets
Battery degradation isn't random. Geotab's 2025–2026 analysis of over 22,700 EVs identified clear patterns that every fleet manager can control — or at least manage. Here are the five factors, ranked by real-world impact.
1
DC Fast Charging Overuse
Vehicles relying on high-power DCFC above 100 kW degrade at up to 3.0% per year — nearly double the 1.5% rate of AC-primary buses. The high current generates excess heat that damages the cathode structure over time.
Reserve DCFC for operational necessity. Size overnight AC Level 2 charging to handle 80%+ of your fleet's daily needs.
2
High Charge Cycle Frequency
Vehicles completing a full charge cycle every 1–2 days experience 0.8% higher annual degradation than low-cycle buses — that's roughly 6% additional loss over the vehicle's life.
Use shallow, frequent charges (50%→80%) rather than deep cycles (10%→100%). LFP batteries in modern school buses actually prefer this pattern.
3
Extreme Temperature Exposure
Hot climates add approximately 0.4% annual degradation due to thermal stress. Cold weather causes temporary range loss (reversible), but charging in extreme cold can cause permanent lithium plating damage.
Pre-condition batteries before charging in winter. Use depot covered parking where possible. Ensure thermal management systems are included in PM schedules.
4
Prolonged Extreme SOC Levels
Buses sitting above 80% or below 20% SOC for more than 80% of their total time experience accelerated chemical breakdown of the electrolyte. Summer storage at full charge is a silent killer.
Store idle buses at 40–60% SOC. Set CMMS alerts when any bus sits above 90% or below 15% for more than 48 hours.
5
Calendar Aging (Time Alone)
Even a parked, unplugged bus ages. Electrolyte decomposition and lithium plating continue regardless of use. This is the one factor you can't eliminate — only manage.
Maximize utilization. An idle bus still ages — so put it to work. Track calendar age alongside cycle age in your CMMS.
See how BusCMMS auto-flags every degradation risk factor for your buses
The EV Battery Monitoring Checklist Your Shop Needs Now
Your diesel PM schedule doesn't translate to EV. Here's the battery health monitoring workflow that top-performing electric school bus fleets are following in 2026 — adapted for shop teams transitioning from diesel.
Daily
Review SOC at dispatch — confirm minimum 60% for AM routes
Check BMS fault codes on dashboard — clear or escalate
Verify overnight charge completed without interruption
Weekly
Log per-bus energy consumption (kWh/mile) and compare to baseline
Review charging patterns — flag any bus over 50% DC fast charge use
Check thermal management system coolant levels and temps
Monthly
Record SOH reading for every EV bus — compare to prior month
Run cell voltage imbalance scan — flag variance above 50mV
Inspect charging cables, connectors, and EVSE equipment
Update degradation trend chart per bus — escalate any 3%+ annual rate
Quarterly
Full thermal management system inspection (coolant, pumps, fans)
Cross-reference BMS SOH against independent energy throughput calculation
Review warranty coverage windows — identify buses within 12 months of expiration
Get these checklists pre-loaded in your BusCMMS dashboard — free signup
Your Diesel Techs Can Learn This — With the Right Tools
BusCMMS gives your maintenance team pre-built EV battery monitoring workflows, automated SOH tracking, and degradation alerts — so your experienced technicians can manage electric buses without a PhD in electrochemistry.
Charging Strategy: The Biggest Lever You Can Pull
Charging power is the single most controllable factor affecting battery life. How you charge matters more than how much you drive. Here's what the data says about school bus charging strategies.
Optimized Strategy
AC Level 2 overnight (6–8 hours, 19.2 kW)
Charge to 80% SOC for daily routes
DCFC only for midday top-ups when routes demand it
Store summer-idle buses at 40–60% SOC
~1.5% annual degradation — 87% SOH at year 8
Common Mistakes
DCFC every night "because it's faster"
Charge to 100% every session "just in case"
Leave buses plugged in at 100% over weekends
No tracking of charge type per bus
~3.0% annual degradation — 76% SOH at year 8
That's the difference between a battery that lasts 15 years and one that needs a $55,000–$85,000 replacement at year 8. And the only way to enforce the right strategy is to track it — per bus, per charge event, every day.
Warranty Tracking: The $45,000 Claim Most Districts Miss
Battery warranties are the most valuable coverage on any vehicle in your fleet — and the easiest to lose. Most manufacturers require documented charging records, maintenance history, and SOH trend data to approve a warranty claim. No data, no claim. Here's the warranty landscape for 2026:
Standard Coverage
8 years / 100,000 miles with 70% capacity guarantee
Extended Coverage
12 years / 150,000 miles — BYD offers unconditional 12-year standard
California Mandate
10 years / 150,000 miles minimum required by state regulation
What Claims Require
Documented SOH history, charging logs, maintenance records, and BMS data — your CMMS should generate all of this automatically
Here's the number that should get your attention: battery health monitoring identifies warranty-eligible claims months in advance — potentially saving $45,000+ per bus. Districts that track SOH monthly can flag buses approaching the 70% threshold while they're still under warranty. Districts that don't track it find out after the warranty has expired.
Book a demo and see automated warranty tracking for your EV fleet
After 15 years managing diesel fleets, the transition to EV battery monitoring felt like learning a new language. But the underlying principle is the same: if you can't measure it, you can't manage it. The difference is that diesel gives you physical warning signs — smoke, noise, oil consumption. Batteries degrade silently. By the time you notice the range is short, you've already lost capacity you could have preserved.
The districts getting this right in 2026 share three traits: they track SOH monthly for every bus, they've standardized their charging protocol around AC Level 2 overnight, and they use CMMS software that generates warranty-ready documentation automatically. The ones struggling are still treating EV buses like diesel buses with a plug — and they're paying for it in premature degradation and missed warranty claims.
Battery health monitoring isn't a nice-to-have. It's the single highest-value maintenance practice for any fleet running electric buses. At $50K–$85K per battery replacement, getting this wrong once costs more than most districts spend on CMMS software in a decade.
Electric buses are coming to your fleet — if they haven't arrived already. The EPA Clean School Bus Program has funded nearly 8,500 bus replacements through 2025, and battery electric is the fastest-growing segment. Your diesel technicians are more than capable of managing this transition. They just need the right monitoring tools and the right data.
Battery health monitoring gives you three things diesel never required: the ability to predict failures years in advance, documented evidence for warranty claims worth tens of thousands of dollars, and the data to optimize charging strategies that extend battery life by 30%+. The districts that invest in proper SOH tracking today will run EV buses for 12–15 years with minimal degradation. The districts that don't will be replacing $70,000 battery packs out of pocket.
BusCMMS is the only fleet maintenance platform built to handle both your diesel fleet and your growing EV fleet in one system — with dedicated battery health dashboards, automated SOH trending, warranty countdown alerts, and charging pattern analytics designed specifically for school bus operations.
Sign up free and start tracking your EV fleet's battery health today
Ready to Monitor Your EV Bus Batteries the Right Way?
Whether you're running 5 electric buses or 50, BusCMMS gives your maintenance team SOH tracking, degradation alerts, warranty management, and charging analytics — built for school bus fleets, not adapted from trucking software.
What is a good State of Health (SOH) percentage for an electric school bus?
A new electric school bus starts at 100% SOH. Anything above 90% is excellent. Between 80%–90% is normal for buses in the 5–10 year range. Below 80% is the industry threshold where range loss becomes operationally significant — you'll start losing routes. Most OEM warranties guarantee at least 70% capacity over 8–12 years. If your bus drops below 70% SOH while still under warranty, you're likely eligible for a battery replacement claim worth $45,000–$70,000.
How often should I check battery health on my electric buses?
SOH should be formally recorded at least monthly for every electric bus in your fleet. Daily monitoring should include SOC at dispatch and BMS fault codes. Weekly reviews should cover energy consumption trends (kWh/mile) and charging pattern analysis. Quarterly, cross-reference BMS SOH against independent energy throughput calculations to catch BMS calibration errors. A CMMS platform like BusCMMS automates most of this tracking, so your team reviews dashboards rather than pulling data manually.
Does DC fast charging really damage electric bus batteries?
It's not black and white. Geotab's 2025–2026 study found that heavy DCFC users (above 100 kW for more than 12% of charging sessions) experience up to 3.0% annual degradation — roughly double the rate of AC-primary chargers. That said, modern LFP batteries in school buses handle fast charging better than older NMC chemistry. The key is balance: use AC Level 2 overnight for your baseline, and reserve DCFC for midday operational needs when routes require it. Track the ratio per bus in your CMMS.
How much does it cost to replace an electric school bus battery?
As of 2026, a full battery pack replacement for a school bus runs $55,000–$85,000 — that includes the pack ($50,000–$70,000 for 155 kWh), labor ($3,000–$8,000), and diagnostics. This is down significantly from $110,000+ in 2022–2023 as pack prices have dropped to approximately $80/kWh. Critically, 90% of replacements occur under warranty at no cost to the operator — but only if you have documented charging records and SOH history. Battery prices are projected to continue falling; replacements needed in the late 2030s could cost 40–50% less than today.
Can my existing diesel technicians learn to maintain electric bus batteries?
Absolutely — and they should. Your diesel technicians already understand preventive maintenance, work order workflows, and compliance documentation. Battery health monitoring is a new skill set, not a new career. The key training areas are high-voltage safety certification (HV1 and HV2), BMS data interpretation, thermal management system maintenance, and EVSE troubleshooting. What they don't need is a platform that treats them like software engineers. BusCMMS translates battery data into the same maintenance language your team already speaks — work orders, PM schedules, and inspection checklists.







