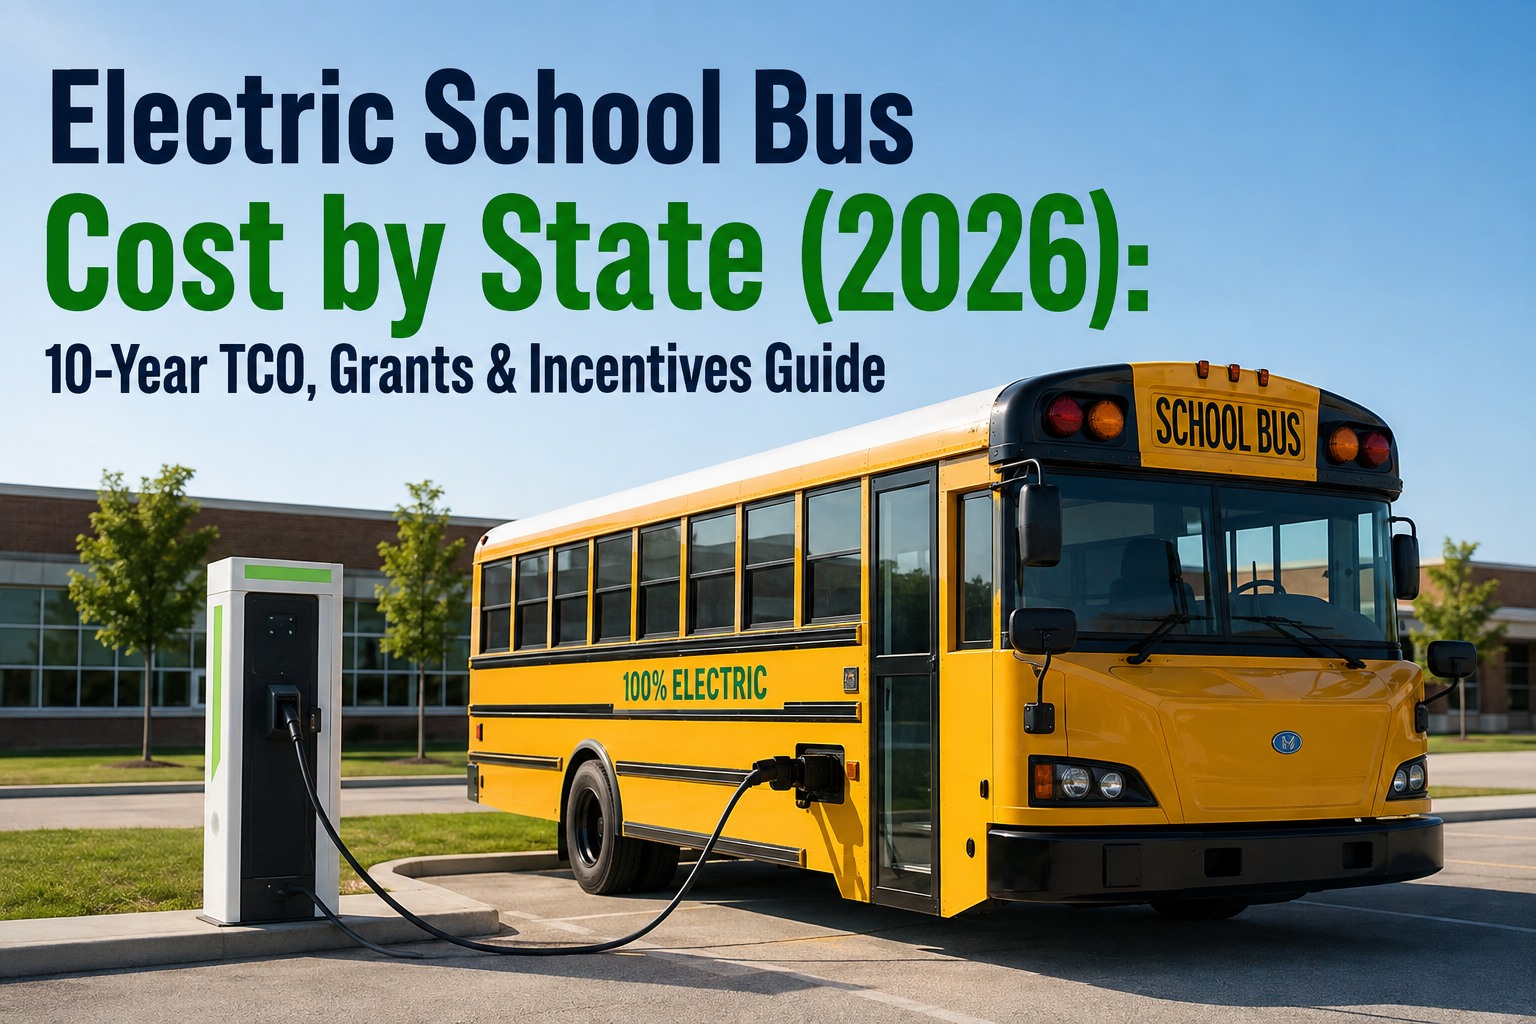
Ask ten transportation directors what an electric bus really costs their district and you'll get ten different answers. The sticker price is roughly the same everywhere. What changes -- dramatically -- is the layer of federal, state, and utility programs available in each state, and the electricity rate that runs the bus for the next decade. This is a plain-English walkthrough of both, with the math worked out. See your state's real net cost per bus → book a 20-min demo.
Electric School Bus Cost by State (2026)
10-year TCO, EPA + state grants, utility rebates, and electricity rates -- what your district actually pays after the stack is applied.
Same bus. Different state. Radically different cost.
The Cost of Not Knowing Your State's Stack
Every year, districts miss grants that funded 60–80% of an electric bus.
NY Program Funds
NYSERDA's School Bus Incentive Program runs first-come, first-serve. Districts that apply late get nothing.
CO Utility Rebate
Xcel Energy's per-project rebate stacks on top of federal money. Districts that don't ask, don't get.
EPA Gap Per Bus
Priority districts get $325K/bus. Non-priority get $170K. Filing under the wrong category leaves $155K on the table.
Make-Ready Programs
Some utilities cover 50–100% of charger site prep -- separately from bus grants. Most districts skip filing.
Grant leakage adds up fast
A 20-bus procurement that misses one utility rebate and files the wrong EPA tier costs the district roughly $3.6M in avoidable spend. Board hears about it in the fiscal year 2 budget review, not fiscal year 1 purchasing.
Your district's real net cost per bus, mapped against every stacked incentive available. Get your state's stack calculated on your fleet → book a 20-min demo.
The 3 Numbers That Change By State
Everything else is roughly the same. These three make or break your TCO.
Incentive Stack Total
The biggest single variable. Federal EPA alone maxes at $325K; states add $50K–$150K+ on top; utilities add make-ready dollars.
Commercial Electricity Rate
Per kWh, EIA Feb 2026. 5x variance from North Dakota to Hawaii. Directly drives 10-year fuel cost.
Charging Infrastructure Cost
Per L2 charger installed. Depends on utility service upgrade, panel capacity, trenching, and make-ready program coverage.
Electricity Rates: The 10-Year Fuel Bill
The gap between top and bottom tiers is $110K+ per bus over a decade.
The paradox: High-electricity-rate states (California, NY, MA) are also the states with the biggest incentive stacks. In practice, a California district often pays less net than a Texas district, even with 3x the electricity rate. The stack outweighs the fuel.
Get your electricity rate + incentive stack + fleet miles run as one 10-year TCO. See your true 10-year cost per bus → book a demo.
4 States, 4 Real Stack Examples
What the incentive math actually looks like on the ground.
Elk Grove USD (real)
2023 EPA CSBP Rebate AwardPriority district + CA layered programs. 16 buses funded at $5.5M federal award.
Typical upstate district
NYSERDA Bus Incentive Program$500M state program. First-come first-serve. Deadline discipline separates funded from unfunded.
Rural mountain district
Xcel Energy service areaRural = priority tier. Utility rebate applies to the project, amortizes across the fleet.
Suburban ISD
Non-priority districtCheapest electricity in the country partly offsets the lower incentive stack over 10 years.
Every dollar tracked per bus, per grant, per fiscal year. See grant-ready fleet reports pulled from your data → book a demo.
The 5-Step Winning Grant Playbook
Districts that get funded do this. Districts that don't, skip step 1.
- 1
Confirm Priority Tier Status
Check EPA's priority list before writing anything. Low-income, rural, or Tribal / BIE districts get $325K/bus. Non-priority gets $170K. Wrong tier filing = $155K per bus left on the table.
- 2
Map State + Utility Programs
Every stacked program has its own deadline, its own paperwork, and its own contact. NYSERDA opens vouchers on a rolling basis. Xcel Energy has a per-project cap. California layers HVIP + air district.
- 3
Pull Real Fleet Operating Data
Winning EPA applications include real per-bus fuel spend, real mileage, and real maintenance history. Not projections. Districts using a CMMS pull this in an afternoon; districts using spreadsheets take a week.
- 4
Sequence the Filings
File federal first (largest single lever), state second (locks per-state cap), utility third (make-ready processing time is longest). Wrong sequence causes weeks of delays.
- 5
Track Award vs Actual Spend
Board wants proof the money landed where the grant said. BusCMMS ties each awarded dollar to a specific bus and a specific work order, exported per fiscal year for audit.
Districts win grants with data, not narratives. See BusCMMS export your grant-ready data → book a demo.
Prefer to explore first? Sign up free and get the 50-state incentive stack worksheet →
Where BusCMMS Fits Your State Procurement
Six ways your fleet data turns into grant dollars.
Grant-Ready Reports
Per-bus fuel spend, mileage, and maintenance history exported for EPA applications in one click.
Per-Bus TCO Tracking
Real 10-year cost per bus computed against your state's electricity rate and PM history.
Award-to-Bus Traceability
Grant dollars tied to specific bus VINs. Board sees where the money actually went.
Deadline Tracker
State program windows and filing deadlines calendared per district. No more missed rebates.
Charger Uptime Reporting
Make-ready funders want proof the chargers work. BusCMMS tracks it as a maintainable asset.
Fuel-Type PM Templates
Electric bus PM built in from day one. No off-the-shelf trucking CMMS rewrite needed.
We're a small rural district. Board thought there was no way we could afford electric buses. Then we hit priority tier for federal at $325K, layered our state voucher on top, and got the utility to cover most of the charger install. Net cost per bus came in under $30K. Buses that would've cost us $340K each cash. The stack wasn't magic -- it was paperwork we didn't know existed until we sat down with someone who tracks this per state.
Still reading? Then you already know your district's leaving grant money on the table. Get your state's stack calculated in 20 min →
Frequently Asked Questions
How much does an electric school bus really cost after all state and federal incentives?
Sticker price for a Type C electric school bus in 2026 runs $300K-$400K. Real net cost after stacked incentives varies enormously by state. Priority-tier districts in California can end up at $0-$50K per bus after EPA CSBP ($325K) plus California HVIP and air district vouchers. Colorado rural districts using Xcel Energy service can hit under $30K per bus once the utility rebate is layered. Non-priority Texas districts typically land at $145K-$170K per bus with federal only. A New York district using NYSERDA's $500M School Bus Incentive Program plus utility make-ready commonly nets to $40K-$70K per bus. The gap between the best and worst state stacks is over $200K per bus.
What state programs stack on top of the federal EPA Clean School Bus Program?
Multiple states run their own incentive programs that stack on top of the federal EPA CSBP award. Major examples in 2026: New York NYSERDA School Bus Incentive Program ($500M), Texas All Electric Program ($95M), California HVIP plus regional air district vouchers, Colorado Xcel Energy Electric School Bus Rebate (up to $275K per project), Massachusetts MOR-EV Trucks program, Georgia Power make-ready infrastructure program. WRI's Electric School Bus Initiative reports over $2.5 billion in state-level funding for which electric school buses qualify. In addition, utility make-ready programs cover 50-100% of the site prep for charging infrastructure -- a separate lever that most districts skip filing.
Which states have the cheapest and most expensive electricity for charging buses?
Per EIA data as of February 2026, the cheapest commercial electricity rates are in North Dakota (7.05 cents/kWh), Oklahoma (8.77 cents/kWh), Texas (8.35-8.90 cents/kWh), Nevada, Idaho, and Wyoming (roughly 9-10 cents). The most expensive mainland states are Massachusetts (25.27 cents/kWh), California (24.73 cents/kWh), Connecticut (24.59 cents/kWh), Maine, and New York. Hawaii is an outlier at 38.62 cents/kWh due to island grid isolation. Over a 10-year bus lifecycle, the fuel cost gap between the cheapest and most expensive mainland states runs $60K-$80K per bus. Districts often find high-electricity-rate states offset this with much larger incentive stacks.
What's a priority district and how does that change my EPA award?
EPA's Clean School Bus Program awards up to $325,000 per electric bus to priority districts and up to $170,000 per bus to non-priority districts -- a $155K per-bus difference. Priority status covers low-income districts (based on Title I eligibility and free/reduced-lunch percentages), rural districts, and Tribal or BIE-funded schools. Filing under the wrong tier is the single most common way districts leave federal money on the table. If your district straddles categories or you're unsure of your priority status, verify with your regional EPA office before writing the application. The application asks for supporting documentation, and misclassification triggers rework and delays.
How does BusCMMS help districts win more grant money?
EPA and state grant applications increasingly require real fleet operating data -- per-bus fuel spend, per-bus mileage, per-bus maintenance history -- not projections. Districts using BusCMMS pull this data in one click and file within the application window. Districts using spreadsheets take a week to assemble it and often miss deadlines. BusCMMS also ties each awarded dollar to a specific bus VIN, which is what auditors and board members ask for in the fiscal year after the award. The deadline tracker calendars state program filing windows so districts stop missing rolling first-come-first-serve programs like NYSERDA. And the charger uptime reports satisfy make-ready program compliance documentation.







