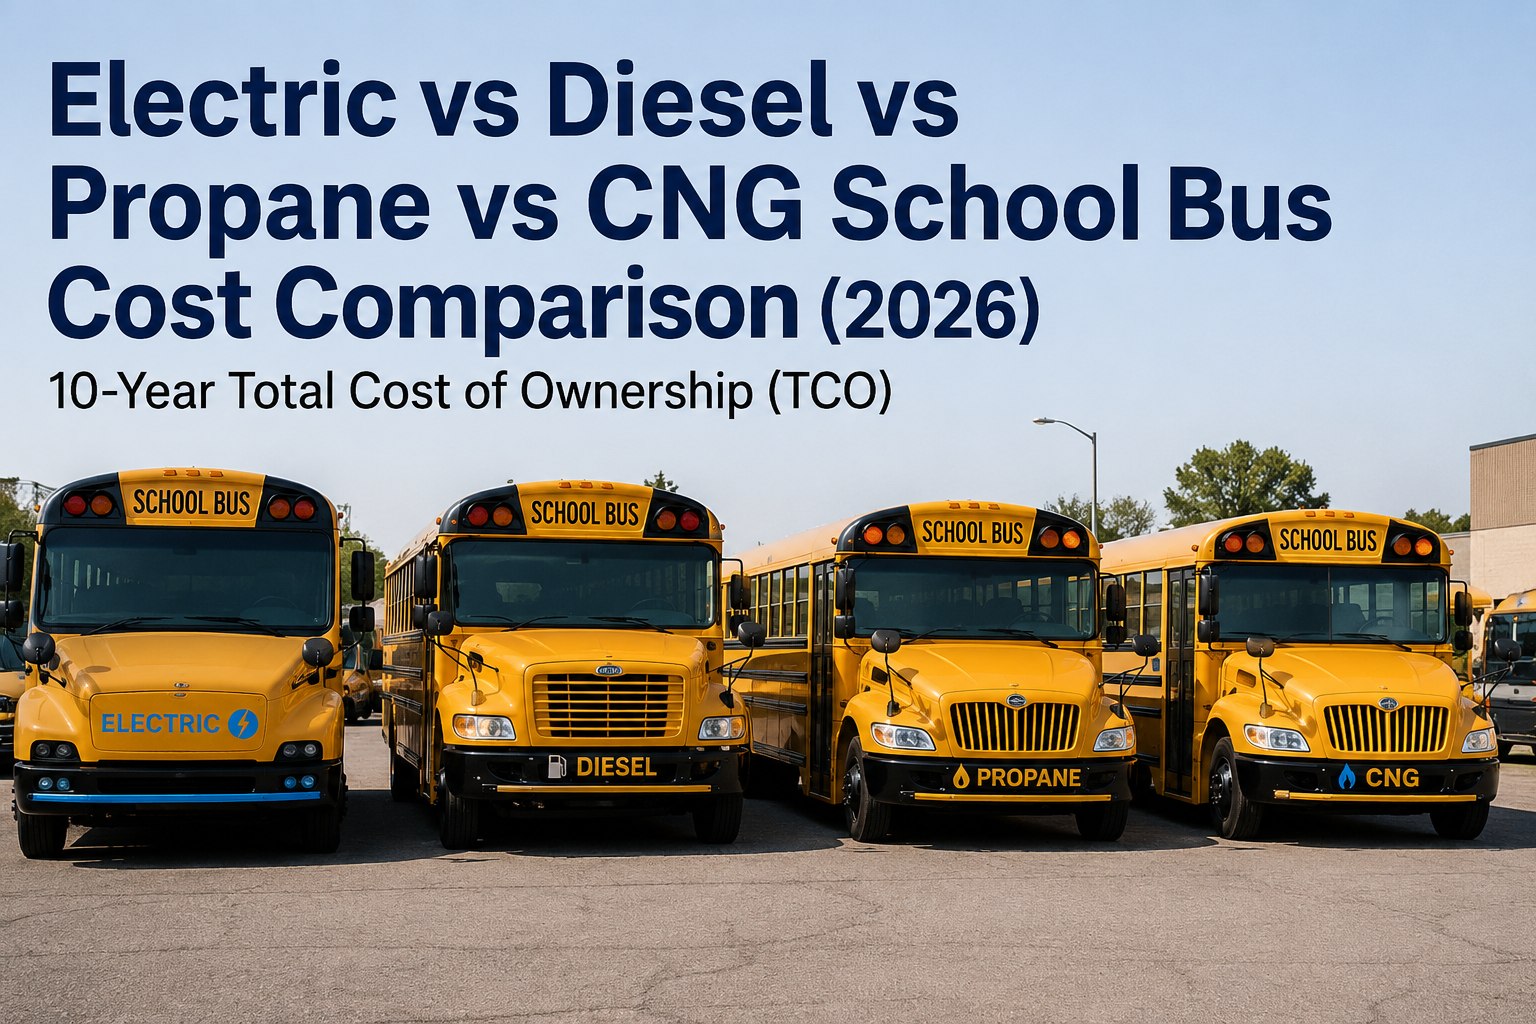
Diesel or electric? Propane or CNG? Over 10 years, the wrong choice costs your district $200K+ per bus. This 2026 total cost of ownership breakdown compares purchase price, fuel, maintenance, and infrastructure across all four fuel types -- with real fleet data, not vendor claims. Run your fleet's TCO in BusCMMS → book a 20-min demo.
Electric vs Diesel vs Propane vs CNG School Bus Cost
10-year total cost of ownership showdown -- purchase price, fuel, maintenance, and infrastructure across all four fuel types.
- 1ELECTRICCHEAPEST WITH INCENTIVES$410K
- 2CNGFuel cheap, station heavy$518K
- 3PROPANEMiddle ground$522K
- 4DIESELCheapest upfront, priciest overall$653K
Where the Money Actually Goes
Each fuel type spends its dollars differently across four buckets.
DIESEL
- Upfront: $120K
- Fuel: $346K
- Maint: $156K
- Infra: $31K
CNG
- Upfront: $160K
- Fuel: $166K
- Maint: $98K
- Infra: $94K
PROPANE
- Upfront: $130K
- Fuel: $230K
- Maint: $115K
- Infra: $47K
ELECTRIC
- Net upfront: $155K
- Fuel: $78K
- Maint: $98K
- Infra: $79K
*Electric net upfront assumes EPA Clean School Bus Program rebate applied. See per-bus cost breakdowns tracked in BusCMMS → book a demo.
Per-Mile Cost: The Number That Runs Your Budget
Fuel + maintenance per mile. This is what actually shows up on operating reports.
The multiplier effect: Twin Rivers USD (Sacramento) reports real electric bus operating cost of $0.19/mile vs $0.82/mile for diesel. Over 15,000 annual miles per bus, that's $9,450/bus/year saved. Across a 40-bus fleet, that's $378K/year.
Every mile logged, every gallon tracked, every dollar attributed. See per-mile cost tracked per bus in BusCMMS → book a demo.
Fuel-Type Profiles: The Real Trade-Offs
What each fuel actually gets you -- and what it costs beyond dollars.
DIESEL
$110K–$130K upfrontBest for: rural districts with long routes, no gas main access, and existing diesel infrastructure. Cheapest to buy, most expensive to run.
CNG
$150K–$170K upfrontBest for: Texas / Gulf-region districts with cheap natural gas + large fleets that justify a $1M+ fueling station investment. Break-even needs volume.
PROPANE
$120K–$140K upfrontBest for: Districts that want cleaner emissions without EV infrastructure risk. 90%+ NOx reduction vs diesel. Autogas station install is affordable.
ELECTRIC
$300K–$400K stickerBest for: Priority districts (rural, low-income, Tribal) eligible for max EPA rebates. Urban routes under 100 mi/day. Existing electrical service capacity.
Federal Money on the Table
EPA Clean School Bus Program can cover 50–80% of an electric bus.
EPA Clean School Bus Program
Approximately 8,500 bus replacements funded so far. 2026 revamp expanded eligibility to CNG, propane, and hydrogen -- but at least 50% must still go to zero-emission buses.
Up to $325K per bus
- Low-income districts
- Rural districts
- Tribal / BIE-funded schools
- Bus replacement + charging infrastructure
Up to $170K per bus
- Standard eligibility districts
- Applies to electric buses primarily
- Charging infrastructure eligible
- Fleet planning documentation required
Strong grant applications are backed by real fleet operating data -- not projections. Generate grant-ready fleet reports from BusCMMS → book a demo.
Break-Even: When Each Fuel Pays Back Its Premium
Purchase premium recovered through fuel + maintenance savings.
- DIESEL
- PROPANE
- CNG
- ELECTRIC
Electric hits parity with diesel by end of decade even without subsidies, per Electric School Bus Initiative projections. Propane pays back fastest for districts already running diesel; CNG needs high volume to justify the station.
Which Fuel Wins for YOUR District?
The right answer depends on 4 factors.
Your Route Length
- Under 100 mi/day: Electric shines
- 100–150 mi/day: Electric or Propane
- 150+ mi/day rural: Propane or Diesel
- Mixed activity + charter: Propane / CNG / Diesel
Your Fleet Size
- Under 20 buses: Diesel or Propane
- 20–50 buses: Propane or Electric
- 50+ buses: Electric if incentives; CNG if station shared
- 200+ buses: Mixed fleet strategy
Your Grant Eligibility
- Priority (rural/low-income/Tribal): Electric
- Non-priority: Propane or CNG
- State-level programs: check TX, CA, NY, NC
- No grant access: Propane most likely winner
Your Infrastructure
- Existing diesel yard: Diesel or Propane
- Natural gas main nearby: CNG viable
- Grid capacity + panel: Electric feasible
- No investment appetite: Diesel default
Most districts land on a mixed fleet -- not a single fuel type. Track mixed-fuel TCO in one dashboard → sign up free.
Why Fleets Track TCO in BusCMMS
Six reasons procurement decisions get better with real data underneath.
Fuel-Type-Specific PM
Diesel, propane, CNG, electric schedules run separately -- no cross-contaminated intervals.
Per-Bus TCO Reports
Actual fuel + maintenance + downtime rolled up per bus, per fuel type, per year.
Grant-Ready Documentation
EPA Clean School Bus Program applications need real operating data. BusCMMS exports it.
Charging Station Uptime
Charger availability tracked as a maintainable asset. No more surprise dead depots.
Fuel Card Reconciliation
Cross-check gallons vs mileage per bus. Catch fuel theft and card misuse fast.
Board-Ready Reports
Superintendent needs TCO per fuel type for the next capital vote. One-click export.
We were quoted the electric buses at $340K each and the diesel at $118K. Board looked at the sticker and killed the electric procurement in five minutes. Two years later, with fuel and maintenance data pulled per bus from our CMMS, we ran the actual TCO. Electric was $85K cheaper over 12 years even before grant money. Same board, different vote. Data is what changed the conversation.
Frequently Asked Questions
What is the 10-year total cost of ownership for electric vs diesel vs propane vs CNG school buses?
Based on Environmental Defense Fund analysis and verified against 2026 fleet operating data, 10-year TCO per bus averages approximately $410K for electric (with EPA Clean School Bus Program rebates applied), $518K for CNG, $522K for propane, and $653K for diesel. Electric wins on lifetime cost despite the highest sticker price because fuel and maintenance costs are dramatically lower -- roughly $0.19/mile in real fleet operations versus $0.65+/mile for diesel. These are averages; actual TCO depends on route length, fleet size, incentive eligibility, local energy prices, and infrastructure investment.
How much do electric school buses actually save on fuel and maintenance?
Electric school buses reduce fuel costs by approximately 60–75% versus diesel, translating to roughly $0.14–$0.28 per mile versus $0.49–$0.82 for diesel. Twin Rivers Unified School District in Sacramento reports real electric operating cost of $0.19/mile versus $0.82/mile for their diesel comparison, an approximate 80% reduction. Maintenance costs drop 30–50% because electric drivetrains have no oil changes, no transmission fluid, no DPF/DEF aftertreatment, and 80% less brake wear from regenerative braking. Combined annual savings run $4,000–$11,000 per bus.
What federal funding is available for alternative-fuel school buses?
The EPA Clean School Bus Program is the primary federal funding source. Priority districts (low-income, rural, Tribal / BIE-funded) can receive up to $325,000 per electric bus including charging infrastructure. Non-priority districts can receive up to $170,000 per bus. Through 2025, the program awarded approximately $3 billion for around 8,500 bus replacements. A 2026 program revamp expanded eligibility to CNG, propane, and hydrogen fuels, but at least 50% of funding must still go to zero-emission buses. State-level programs in California, Texas, New York, and North Carolina also stack with federal money.
Which fuel type is best for my school district?
Four factors decide it. Route length: electric wins under 100 miles per day; diesel or propane wins for 150+ mile rural routes. Fleet size: small fleets under 20 buses typically favor diesel or propane because infrastructure investment doesn't amortize; large fleets over 50 buses can justify electric or CNG. Grant eligibility: priority districts should default to electric to capture max rebate; non-priority districts often land on propane. Existing infrastructure: districts with a diesel yard already installed lean diesel or propane; districts with natural gas main access get CNG viability; districts with electrical service headroom get electric feasibility. Most large districts end up running mixed fleets, not one fuel type.
How does BusCMMS help with fuel-type procurement decisions?
BusCMMS runs fuel-type-specific PM schedules for diesel, propane, CNG, and electric side-by-side in the same dashboard. Per-bus TCO reports pull real fuel spend, maintenance labor, and parts costs against actual mileage from your telematics odometer. That data feeds EPA Clean School Bus Program grant applications with the real operating history that reviewers want to see. Charging station uptime tracks alongside bus PM. Fuel card reconciliation catches theft and miscoding. Board-ready TCO reports export in one click for capital procurement votes -- so the conversation shifts from vendor slides to your fleet's actual numbers.







