Every morning, thousands of bus fleets across America mobilize to transport students, commuters, and passengers. Behind each operational bus is a maintenance program designed to keep vehicles safe, reliable, and compliant. Yet the complexity of bus fleet maintenance—the inspections, repairs, scheduling, parts management, and compliance requirements—often overwhelms fleet managers who inherit systems without understanding how all the pieces fit together.
Unlike passenger vehicles that visit a mechanic occasionally, commercial buses require structured maintenance programs that account for heavy utilization, passenger safety requirements, and regulatory compliance. Aside from garbage trucks, school buses require the most maintenance of any municipal fleet. Understanding how this maintenance works—from daily driver checks to major component overhauls—is essential for anyone responsible for keeping buses on the road.
This guide explains the complete bus fleet maintenance ecosystem: the processes that keep vehicles operational, the costs involved at each stage, and the challenges that make fleet maintenance one of the most demanding aspects of transportation operations.
The Bus Fleet Maintenance Process: Step by Step
Effective bus maintenance follows a structured workflow that connects drivers, technicians, parts personnel, and fleet managers. Understanding this process reveals how maintenance decisions affect safety, costs, and reliability.
1
Daily Vehicle Inspections
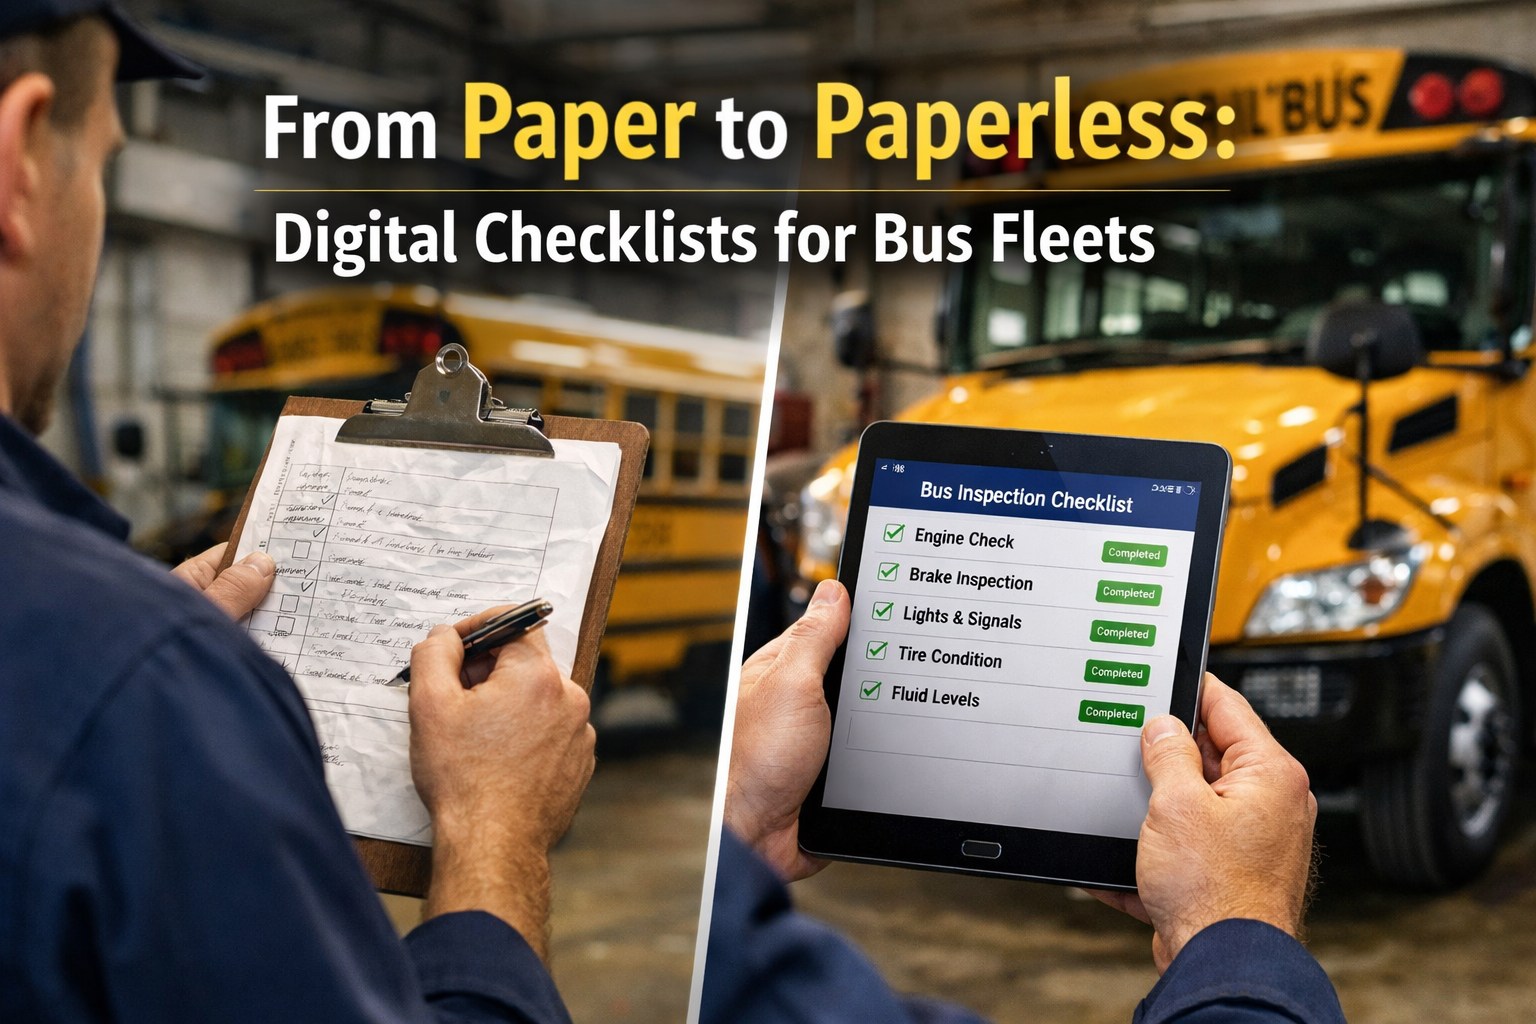
Every operational day begins and ends with driver vehicle inspections—the first line of defense against mechanical failures and safety issues.
Pre-Trip Inspection
Before departing, drivers walk around the bus checking tires, lights, mirrors, fluid levels, brakes, and emergency equipment. They verify that safety systems function and document any defects discovered.
Post-Trip Inspection
After completing routes, drivers check for new issues that developed during operation—unusual sounds, warning lights, handling changes, or passenger-reported problems.
Defect Reporting
Any issues discovered must be documented on Driver Vehicle Inspection Reports (DVIRs). Critical defects may remove the bus from service until repairs are completed.
Federal regulations require commercial vehicle operators to complete these inspections. Failure to comply can result in fines, failed DOT audits, and increased liability in accidents.
2
Issue Identification and Prioritization
Maintenance needs come from multiple sources—driver reports, scheduled service intervals, diagnostic alerts, and physical inspections. Fleet managers must assess and prioritize each issue.
Safety-Critical Issues
Problems affecting brakes, steering, tires, or other safety systems require immediate attention. The bus cannot operate until repairs are complete.
Operational Issues
Problems that don't immediately endanger passengers but affect operation—HVAC failures, door issues, lighting problems—are scheduled based on severity and available resources.
Scheduled Maintenance
Preventive maintenance tasks trigger based on mileage, engine hours, or calendar intervals regardless of vehicle condition.
3
Work Order Creation and Assignment
Once maintenance needs are identified, work orders document exactly what needs to be done and who will do it.
Work Order Details
Each work order specifies the vehicle, problem description, priority level, assigned technician, required parts, and estimated labor time.
Technician Assignment
Jobs are routed to technicians based on skills, availability, and current workload. Complex repairs may require specialists; routine maintenance goes to general technicians.
Parts Verification
Before work begins, parts availability is confirmed. Missing parts delay repairs and extend vehicle downtime.
4
Repair and Maintenance Execution
Technicians perform the actual work—diagnosing problems, replacing parts, adjusting systems, and verifying repairs are complete.
Diagnosis
For repair work, technicians first confirm the problem and identify root causes. Modern buses generate diagnostic trouble codes (DTCs) that guide troubleshooting.
Repair Execution
Technicians follow established procedures, using required tools and replacement parts. Labor time is tracked for cost analysis and efficiency measurement.
Quality Verification
After repairs, technicians test the fix to ensure the problem is resolved. Safety-critical repairs may require road tests or supervisor sign-off.
5
Documentation and Return to Service
Completed work is documented, costs are recorded, and the vehicle is cleared to return to operation.
Work Order Closure
Technicians document work performed, parts used, labor hours, and any additional issues discovered. This creates the service history for each vehicle.
Inventory Updates
Parts used are deducted from inventory. Low stock triggers reorder processes to ensure parts are available for future repairs.
Return to Service
Once cleared, the bus returns to active status and is available for route assignment.
Types of Bus Fleet Maintenance
Bus maintenance falls into three primary categories, each with different cost implications, scheduling requirements, and operational impacts.
Preventive Maintenance (PM)
Scheduled, planned service tasks performed at regular intervals to prevent breakdowns and extend vehicle life.
Common PM Tasks
Oil and filter changes, brake inspections, tire rotations, fluid checks, belt inspections, battery testing, HVAC service, lubrication, lighting checks, safety system verification
Scheduling Methods
Time-based (every 90 days), mileage-based (every 5,000 miles), or engine-hour based. Modern fleets use usage-based scheduling that reflects actual vehicle operation rather than arbitrary calendar intervals.
Cost Impact
Preventive maintenance saves 12-18% compared to reactive maintenance. Each dollar invested in PM saves an average of $5 in future repairs.
Corrective Maintenance
Repairs performed to fix problems discovered before they cause breakdowns—the "pot of gold" for uptime because you can plan repairs for convenient times.
Discovery Sources
Driver inspection reports, PM inspections that reveal additional issues, diagnostic trouble codes from vehicle systems, technician observations during other work
Scheduling Approach
Schedule based on severity and urgency. Safety issues require immediate attention; other problems can wait until the next convenient service window.
Cost Impact
Planned corrective repairs cost less than emergency repairs because parts can be sourced at normal prices, labor can be scheduled during regular hours, and the vehicle remains operational until the scheduled repair.
Reactive/Emergency Maintenance
Unplanned repairs performed after a breakdown occurs—the most expensive type of maintenance due to emergency service premiums and operational disruption.
Characteristics
Unpredictable timing, premium labor rates (overtime, emergency calls), expedited parts shipping, potential towing costs, route disruption
Cost Premium
Reactive maintenance costs 40-45% more than planned maintenance. A single unplanned breakdown averages $8,500 when factoring in all costs.
Best Practice
Industry standard targets 80/20 planned-to-reactive maintenance ratio. Fleets below 60% planned maintenance operate in constant firefighting mode with inflated costs.
Ready to shift from reactive to proactive maintenance? See how fleet management software automates scheduling, tracks service history, and prevents costly breakdowns.
Getting Started Book a DemoBus Fleet Maintenance Costs: A Complete Breakdown
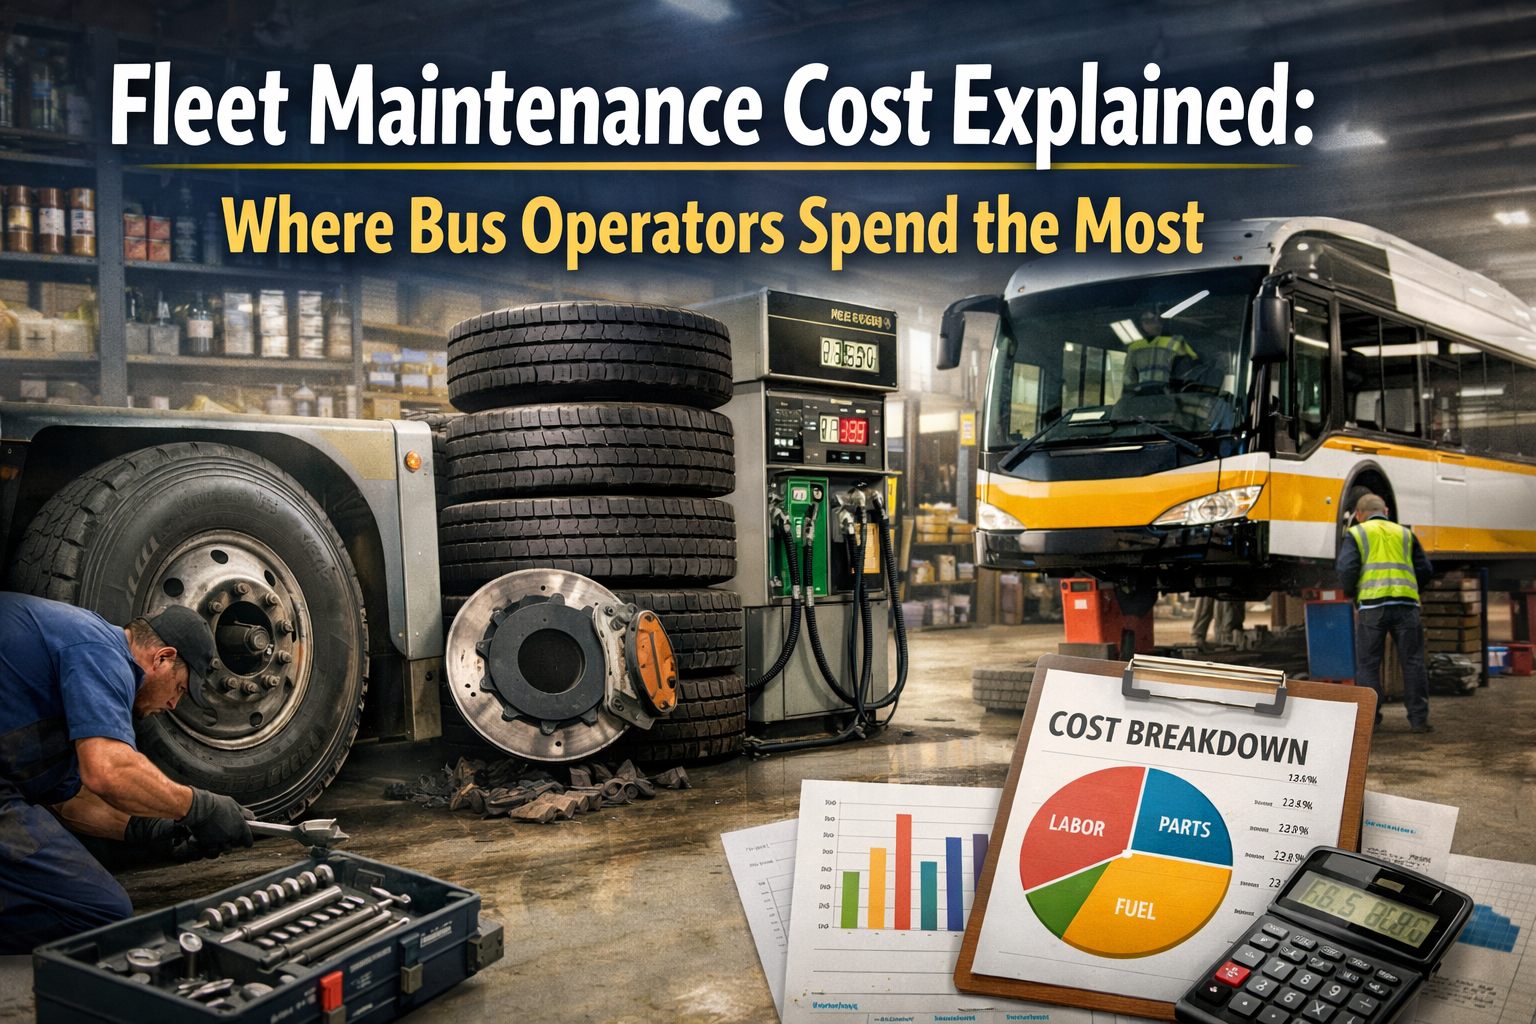
Understanding where maintenance money goes is the first step toward controlling it. Bus maintenance costs fall into distinct categories, each with unique cost drivers and optimization opportunities.
Maintenance typically represents 20-60% of total bus fleet operating expenses, depending on fleet age and operating conditions. The average manufacturing facility spends $15,000-25,000 annually per vehicle on maintenance, but costs vary widely based on vehicle type, age, utilization, and maintenance strategy.
Typical Bus Maintenance Cost Allocation
Labor
28-35%
Technician wages, benefits, overtime. Rising due to technician shortages and increased vehicle complexity.
Parts & Components
25-32%
Replacement parts, fluids, filters. Increased 15-25% since 2022 due to supply chain disruptions and inflation.
Tires
8-12%
Tire replacement, rotation, repairs. Heavy buses with frequent stops accelerate tire wear.
Fluids
6-10%
Oil, coolant, transmission fluid, brake fluid, DEF, windshield washer fluid.
Outside Services
10-18%
Specialized repairs, warranty work, services beyond in-house capability.
Downtime & Emergency Premium
8-15%
Hidden costs from reactive maintenance—this category represents the biggest savings opportunity.
Cost Benchmarks
Per-Mile Cost (Diesel Bus)
$1.00 - $1.53
Well-Managed Fleet (Annual/Bus)
$3,500 - $4,500
Poorly-Managed Fleet (Annual/Bus)
$8,000+
Average Breakdown Cost
$8,500
The 7 Biggest Bus Fleet Maintenance Challenges
Every fleet faces obstacles that can disrupt operations and inflate costs. Understanding these challenges is the first step toward addressing them effectively.
1
Technician Shortages
North America has a critical shortage of qualified technicians, profoundly impacting maintenance costs and operations. As experienced professionals retire, the influx of trained replacements is insufficient. The shortage is further widened by specialized skills required for electric vehicles and advanced driver-assistance systems (ADAS), leading to increased vehicle downtime and operational challenges.
Impact: Increased labor costs, longer repair times, more outsourcing at higher rates, deferred maintenance that leads to bigger problems
2
Rising Maintenance Costs
Maintenance costs have steadily increased, driven by specialized parts, higher labor costs, supply chain disruptions, and aging vehicles requiring more frequent repairs. Parts costs increased 15-25% since 2022, and labor rates climbed as technician shortages intensified. Managing expenses while maintaining operational efficiency has become one of the top fleet maintenance challenges.
Impact: Budget overruns, difficult trade-off decisions, pressure to defer maintenance, reduced profitability
3
Aging Fleet Vehicles
Supply chain disruptions and budget constraints have forced many fleets to keep older vehicles in service longer than planned. Major components (engines, transmissions) typically begin failing between 150,000-200,000 miles. Repairs occurring late in a vehicle's lifecycle are often much more significant and costly. Without cost-per-vehicle tracking, fleets continue pouring money into buses that should be replaced.
Impact: Higher repair frequency and cost, increased breakdowns, more unplanned downtime, safety concerns
4
Parts Supply Chain Disruptions
The aftermath of global disruptions continues to affect parts availability, leading to extended lead times for new vehicles and components. Just-in-time inventory strategies that worked pre-pandemic now create stockouts and emergency orders. Critical parts unavailability can sideline vehicles for days or weeks, multiplying the cost of otherwise simple repairs.
Impact: Extended downtime waiting for parts, emergency shipping premiums, inability to complete scheduled maintenance
5
Compliance and Regulatory Requirements
Bus fleets must maintain compliance with DOT regulations, state inspection requirements, emissions standards, and safety mandates. School buses have specific regulations regarding safety inspections, passenger capacity, and operational standards. Maintaining compliance requires meticulous record-keeping, scheduled inspections, and documentation that satisfies auditors.
Impact: Administrative burden, risk of fines, potential service interruptions, liability exposure
6
Lack of Data Visibility
While 72% of fleets use dedicated maintenance software, many still juggle spreadsheets, paper forms, and multiple platforms. This integration gap creates visibility problems—parts tracked in one system, labor in another, fuel monitored separately. Without unified data, there's no single view of total cost per vehicle or per mile. Analysis requires manual data gathering that rarely happens.
Impact: Uninformed decisions, inability to identify cost drivers, missed optimization opportunities
7
Balancing Preventive vs. Reactive Work
When staff are constantly responding to breakdowns, there's no bandwidth for proactive maintenance. Teams are too busy fighting fires to study what's causing them. The 80/20 planned-to-reactive target becomes impossible when emergency repairs consume available labor hours. This creates a vicious cycle where lack of preventive maintenance causes more breakdowns, which consume more resources.
Impact: Escalating costs, declining reliability, technician burnout, stakeholder dissatisfaction
How Modern Fleets Overcome These Challenges
The competitive gap between proactive and reactive fleets is widening. Fleets that embrace integrated systems, data-driven planning, and strategic maintenance approaches are gaining advantages that compound over time.
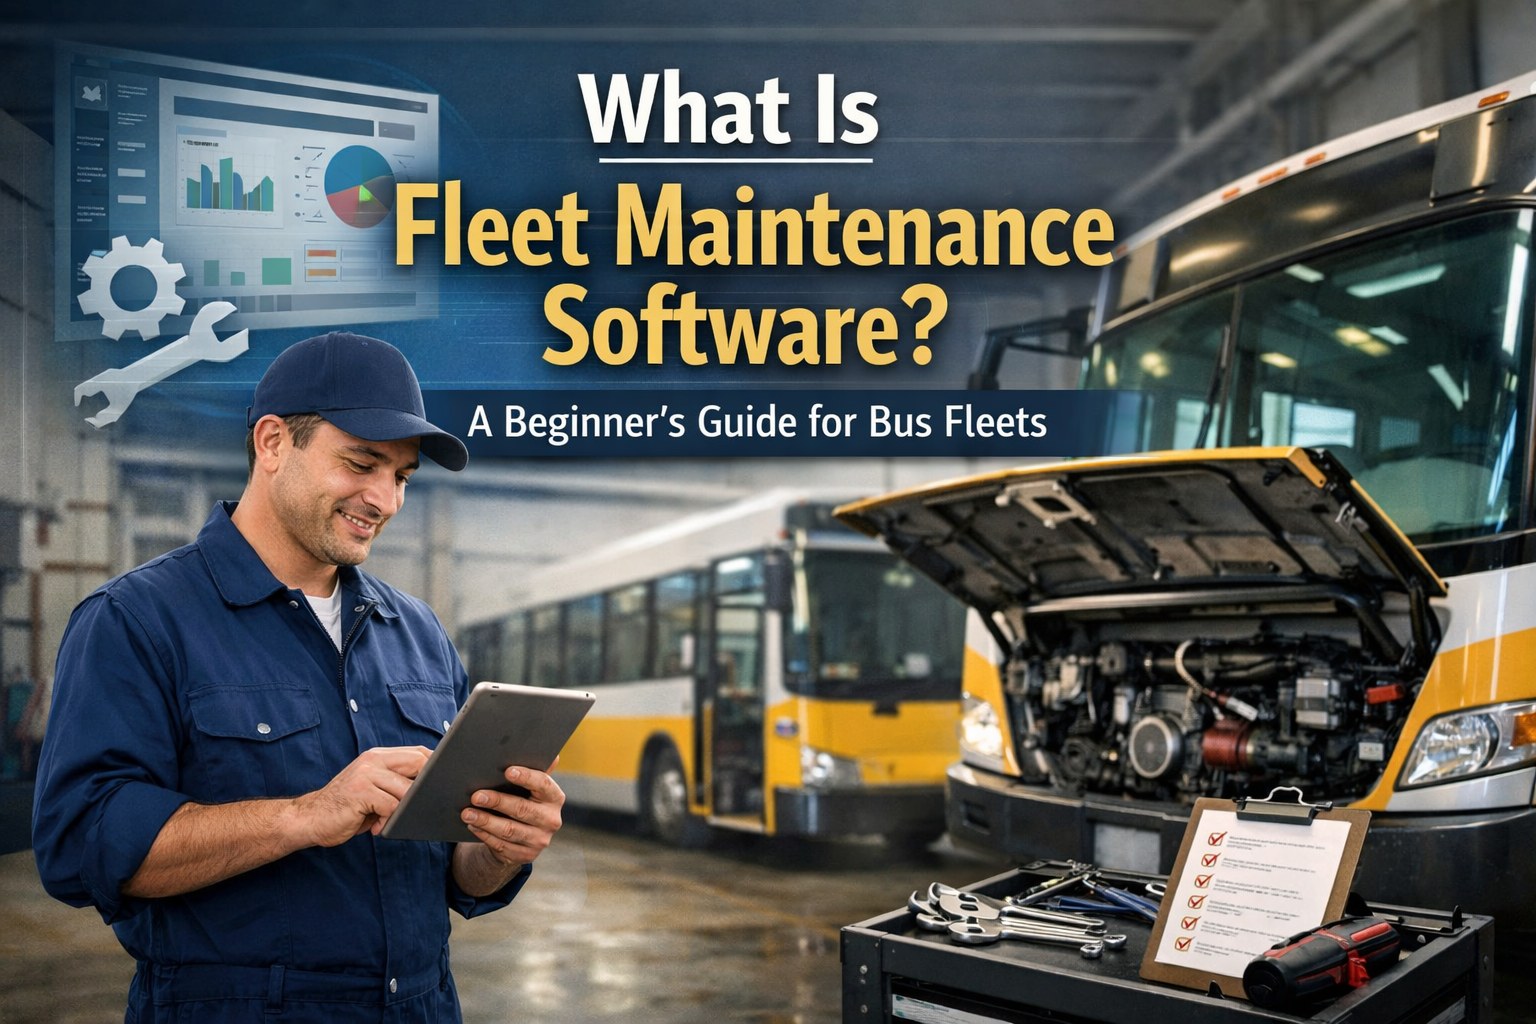
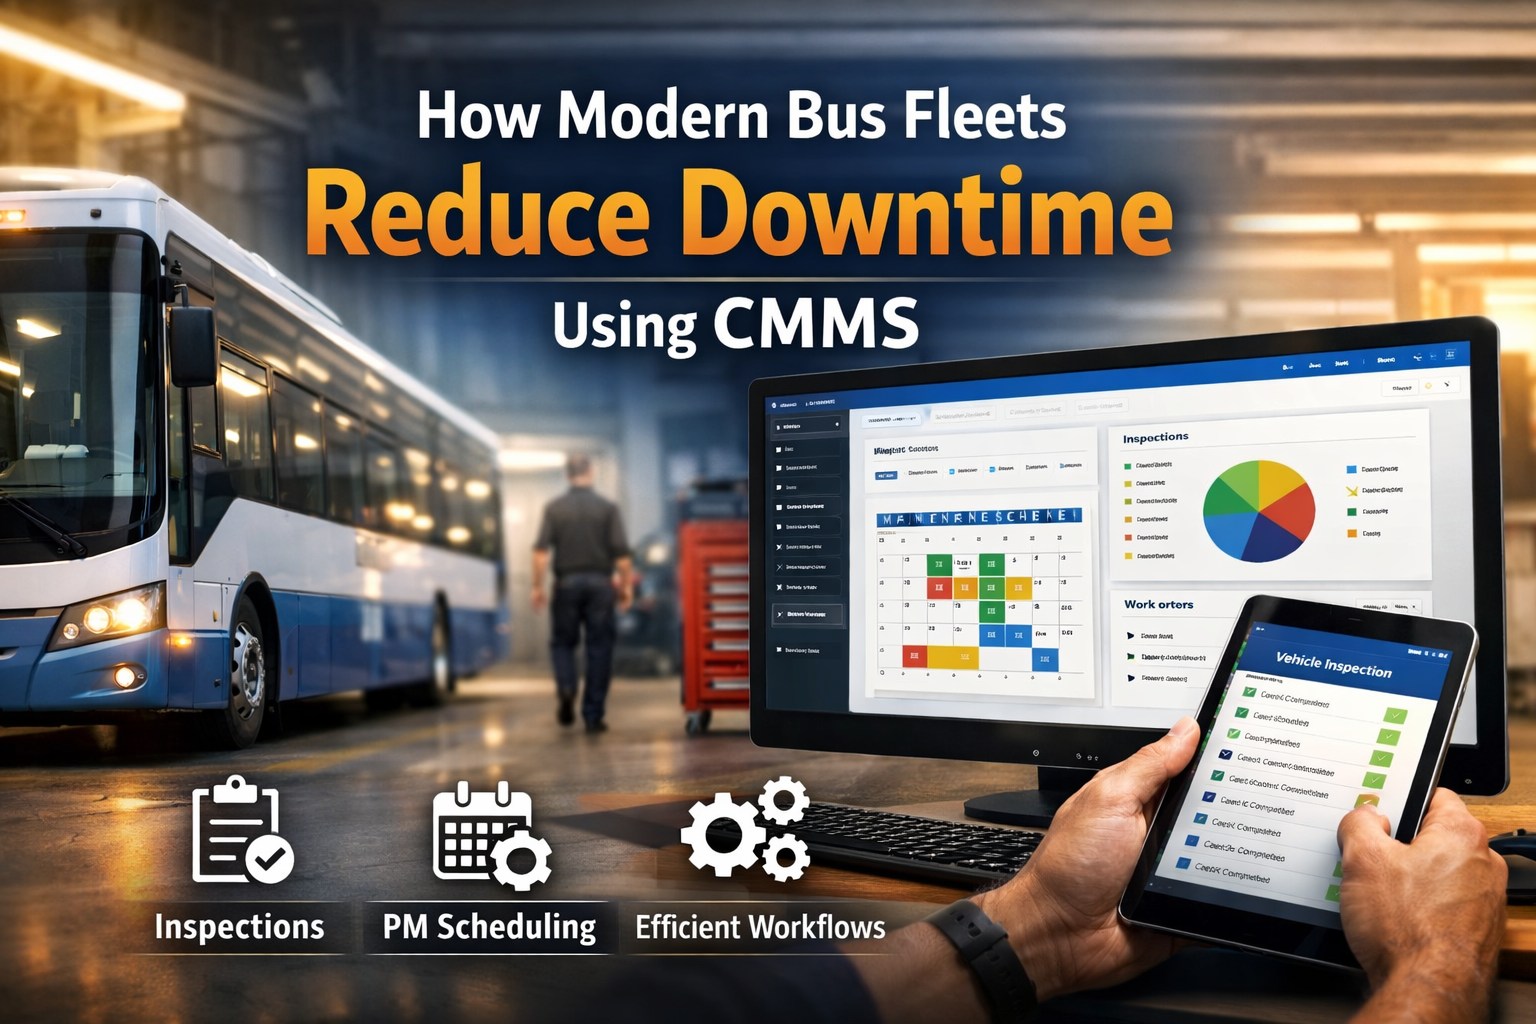
Implement Fleet Management Software (CMMS)
Computerized Maintenance Management Systems consolidate all maintenance data—work orders, service history, parts inventory, costs—into a single platform. This creates the visibility that makes cost control possible. Fleets using CMMS typically see 25-30% reduction in maintenance costs, 40-50% decrease in emergency repairs, and significant improvements in vehicle availability.
Shift to Preventive Maintenance
Building a structured PM program—with automated scheduling, usage-based triggers, and compliance tracking—prevents the breakdowns that consume resources and budgets. Digital work orders and mobile inspections ensure nothing falls through the cracks. Teams that evolve their maintenance strategy save 250+ hours annually while increasing work order completion by 53%.
Optimize Inventory Management
Better inventory systems and diversified parts sourcing reduce stockout risk. ABC classification prioritizes critical parts, while automated reordering prevents both shortages and overstocking. Proper parts tracking can reduce carrying costs by up to 50% while improving fill rates above 95%.
Track Total Cost of Ownership
Fleets that track true TCO can identify vehicles that should be replaced rather than repaired, spot cost anomalies early, and make data-driven decisions about maintenance investments. Without knowing what costs should be, there's no way to identify what's abnormal—a bus costing $12,000 annually might seem acceptable until you learn the fleet average is $5,500.
Invest in Technician Development
With technician shortages worsening, retention becomes critical. Apprenticeship programs, competitive pay, mentorship, and clear career progression paths help retain experienced technicians and develop new talent. Better retention reduces training costs and ensures institutional knowledge remains in-house.
Ready to transform how you manage bus fleet maintenance? Discover how modern CMMS technology creates the visibility and control you need to reduce costs while improving reliability.
Getting Started Book a DemoUnderstanding Maintenance Is the First Step to Controlling It
Bus fleet maintenance is complex—a continuous cycle of inspections, scheduling, repairs, parts management, and compliance documentation. But understanding how the pieces fit together is essential for anyone responsible for keeping buses operational, safe, and cost-effective.
The difference between well-managed and poorly-managed fleets isn't luck or budget size—it's visibility, process, and the discipline to shift from reactive firefighting to proactive prevention. Fleets that invest in understanding their maintenance operations, tracking their costs, and implementing structured processes consistently outperform those operating on intuition and spreadsheets.
Whether you're new to fleet management or looking to optimize an existing operation, the fundamentals remain the same: prevent problems before they occur, catch issues before they escalate, resolve repairs efficiently, and document everything for continuous improvement.
Frequently Asked Questions
Q: What percentage of bus fleet operating costs goes to maintenance?
A: Maintenance typically represents 20-60% of total bus fleet operating expenses, depending on fleet age, operating conditions, and maintenance strategy. Within maintenance budgets, labor accounts for 28-35%, parts 25-32%, tires 8-12%, fluids 6-10%, outside services 10-18%, and emergency/downtime premiums 8-15%. Well-managed fleets keep annual per-bus costs between $3,500-$4,500, while poorly-managed fleets may exceed $8,000.
Q: What is the typical bus fleet maintenance process?
A: The process includes: (1) Daily driver inspections (pre-trip and post-trip), (2) Issue identification and prioritization based on safety and operational impact, (3) Work order creation with technician assignment and parts verification, (4) Repair execution including diagnosis, repair, and quality verification, (5) Documentation and return to service with inventory updates. This cycle repeats continuously with preventive maintenance scheduled at regular intervals.
Q: What are the main types of bus fleet maintenance?
A: Three types: Preventive maintenance (PM) includes scheduled service at regular intervals to prevent breakdowns. Corrective maintenance addresses problems discovered before they cause failures. Reactive/emergency maintenance handles unplanned breakdowns. Industry best practice targets 80/20 planned-to-reactive ratio. Preventive maintenance saves 12-18% compared to reactive approaches.
Q: What are the biggest challenges in bus fleet maintenance?
A: Top challenges include: technician shortages driving up labor costs and extending repair times, rising parts and labor costs, aging vehicles requiring more maintenance, supply chain disruptions affecting parts availability, compliance and regulatory requirements, lack of data visibility across systems, and difficulty balancing preventive vs. reactive work.
Q: How much does an unplanned bus breakdown cost?
A: A single unplanned breakdown averages $8,500 when factoring in towing ($350-$700), emergency repairs at premium labor rates, expedited parts shipping, route disruptions, substitute transportation, and lost service hours. Daily downtime costs range from $488 to $760 per vehicle. Reactive maintenance costs 40-45% more than planned maintenance overall.