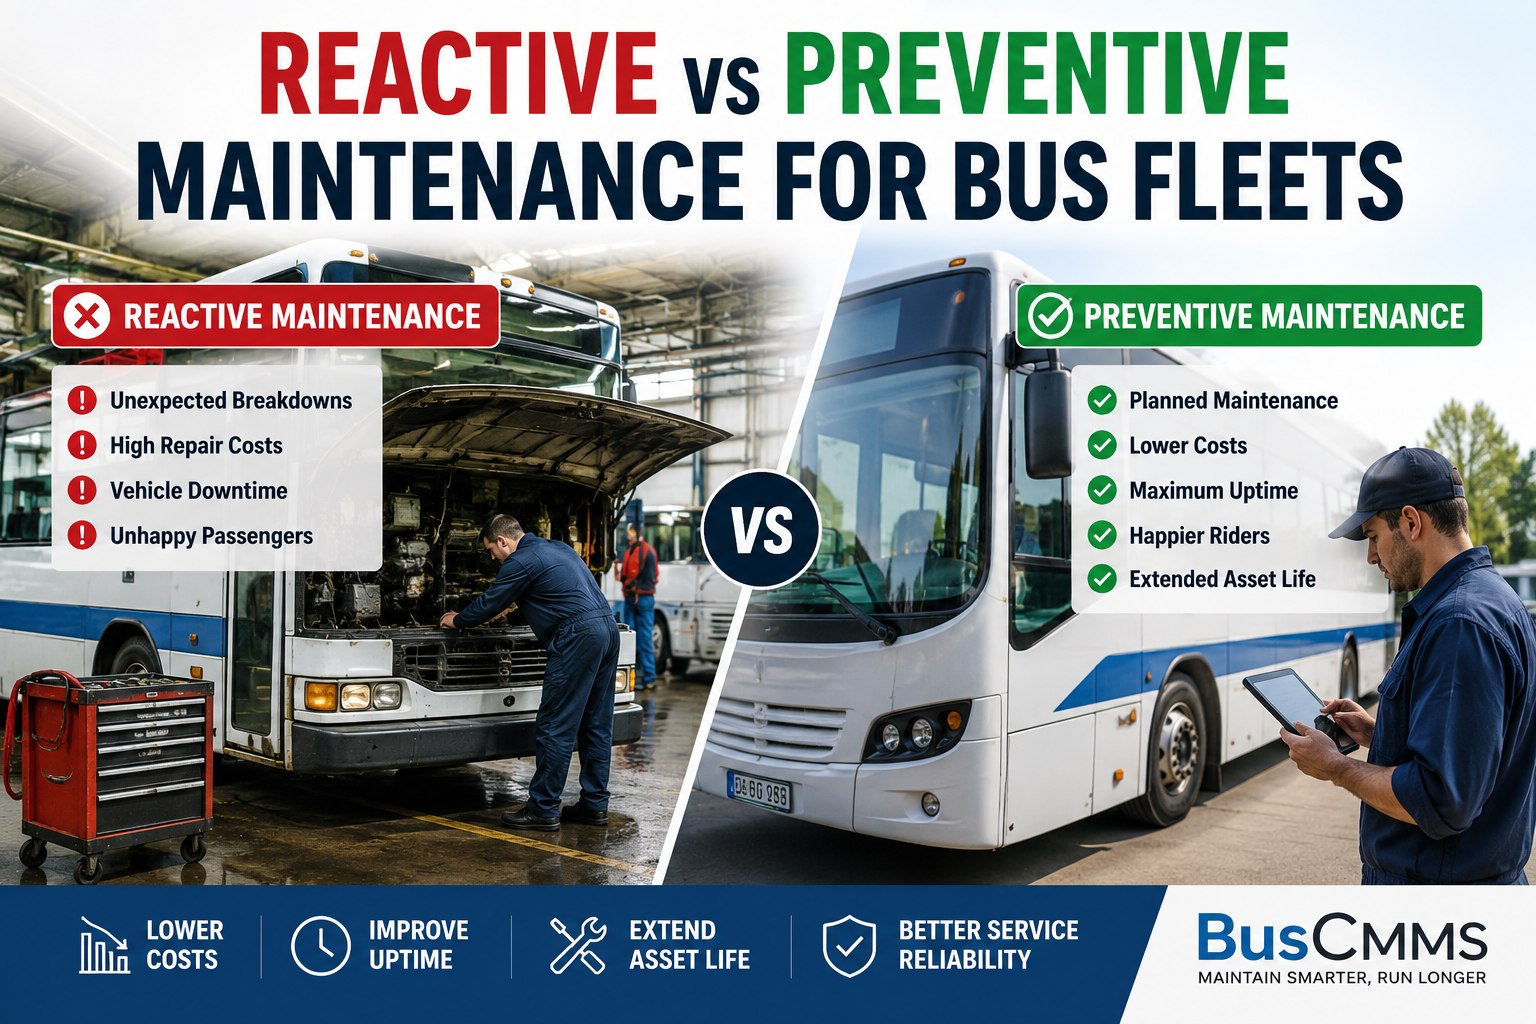
Your maintenance shop can operate two ways. Option one: wait for something to break, then fix it. Option two: service the bus on a schedule before anything breaks. Fleets that run option one -- reactive maintenance -- typically spend 3-5x more per repair, experience 40-70% more unplanned downtime, and get 70-85% fleet availability on a good week. Fleets that run option two -- preventive maintenance -- spend 30% less on maintenance, hit 90-95% availability and never get a 6:12 AM call from a driver whose bus won't start. The debate between reactive vs preventive maintenance for bus fleets is not really a debate anymore. The question is how quickly your fleet can make the shift.
Reactive vs Preventive Maintenance for Bus Fleets: The Real Cost Comparison
Head-to-head on the metrics that matter to transportation directors -- cost per mile, fleet availability, unplanned downtime, road calls, and safety risk. Plus when reactive maintenance still makes sense, when preventive wins, and the hybrid model most well-managed fleets actually run.
What Reactive Maintenance Actually Looks Like
Also called break-fix, corrective, or run-to-failure maintenance. The bus runs until something breaks, then the shop fixes what broke.
The reactive workflow
Bus runs its route normally. Some component wears out or fails. Driver reports the issue (or the bus stops running mid-route). The failed bus goes to the shop. A technician diagnoses and repairs the specific failure. Bus returns to service until the next failure.
This is how most small fleets and many older transit operations still run. It requires no scheduling software, no PM discipline, no cost-per-mile tracking. The maintenance calendar is whatever the drivers report today.
- Low upfront investment in software and training
- No time spent on PM cycles for buses that might have failed anyway
- Works for very small fleets (under 5 buses) with in-house mechanics
- Predictable per-repair cost (you pay only when something breaks)
- Emergency repairs cost 3-5x more than planned repairs
- Unpredictable downtime disrupts routes and forces sub-driver dispatches
- Cascading failures -- one worn part destroys three related components
- Safety risk from undetected wear on brakes, tires, steering
- FMCSA DVIR non-compliance creates audit exposure
- Fleet-wide service life shortened by 20-35%
Book a demo to see the exact cost gap between reactive and preventive on your fleet size.
What Preventive Maintenance Actually Looks Like
Scheduled service based on time, mileage, or engine hours -- executed before failure. The industry standard for well-managed bus fleets.
The preventive workflow
Each bus follows an OEM-recommended PM schedule -- oil changes, filter replacements, brake inspections, fluid analysis, and safety checks at defined intervals. The CMMS surfaces upcoming PM cycles before they come due. Technicians execute the scheduled service, catch any wear issues early, and document everything in a digital DVIR.
Bus stays in service, breakdowns become rare, and the shop moves from firefighting to planned production. This is how every well-managed transit agency and school district transportation department operates.
- Predictable maintenance costs -- easier to budget and forecast
- Fleet availability 90-95% vs 70-85% for reactive shops
- Extended bus service life (see 15 strategies guide)
- FMCSA + FTA compliance built into the workflow
- Parts + labor planning drives inventory optimization
- Safety-critical wear items caught before they fail on route
- Documented PM records support warranty claims
- Upfront investment in CMMS software and technician training
- Some service performed on components that might not have failed
- Requires PM discipline -- skipping cycles undermines the whole approach
- Small fleets need dedicated PM planning time
The Real Numbers: Reactive vs Preventive by Metric
Every metric a transportation director actually reports to the board. Numbers below reflect typical outcomes for well-managed diesel bus fleets in both operating modes.
Cost per mile
Preventive delivers roughly 40-50% lower maintenance cost per mile once the PM program is running smoothly. Savings compound over time.
Fleet availability
Availability is the % of scheduled service days each bus can actually run. Every point of availability = fewer sub buses and less driver overtime.
Unplanned downtime hours
Preventive fleets report 40-70% less unplanned downtime. Downtime that does happen is usually scheduled and shorter.
Road calls per year
Road calls are the most disruptive events in a bus fleet. Each includes tow, sub bus, driver overtime, parent/rider communication, and paperwork.
Bus service life
Preventive fleets get 3-5 additional years of service life on average. Full replacement cost delayed = capital savings that dwarf annual PM investment.
Compliance audit risk
FMCSA DVIR gaps, FTA triennial review findings, and state DOT inspection failures are far more common on reactive-managed fleets.
Book a demo to see how BusCMMS surfaces every one of these metrics for your fleet in real time.
When Reactive Maintenance Actually Makes Sense
There are narrow scenarios where a pure preventive approach is over-engineered. Reactive maintenance is not always wrong -- it is just usually wrong for bus fleets.
Very small fleets (under 5 buses)
A 3-bus church van operation with an owner-mechanic who knows every vehicle intimately can run reactive maintenance effectively. The economics of formal PM programs and CMMS software require more scale.
Non-critical secondary components
Some components genuinely benefit from run-to-failure -- lightbulbs, wiper blades, floor mats. Not worth scheduled replacement cycles for consumables that fail cheaply and safely.
Buses at end of service life
A 16-year-old bus already scheduled for retirement in 6 months may reasonably run reactive for its final stretch -- assuming the safety-critical items (brakes, steering, tires) are still on PM.
Failed components already in PM
When a PM inspection catches a failing part, the repair itself is reactive -- but it is enabled by the preventive framework that surfaced the issue before failure. This is the hybrid model at work.
The honest answer: even fleets that run "reactive" are rarely 100% reactive on safety-critical systems. The question is whether the preventive framework is formal (CMMS, PM schedules, documented DVIRs) or informal (mechanic memory, paper logs, gut feeling). Formal beats informal every time on scale beyond 5 buses.
Why Preventive Wins for 95% of Bus Fleets
Beyond the tiny minority of "reactive makes sense" cases, preventive maintenance delivers measurable wins on every dimension bus fleet operators actually measure.
Safety is not optional
Bus fleets carry children, transit riders, and passengers with disabilities. Reactive maintenance on brakes, steering, tires, and structural components is unacceptable risk. Preventive is not just cheaper -- it is safer.
Compliance is not optional
FMCSA DVIR requirements, FTA triennial reviews, state DOT inspections, and ADA reporting all assume a preventive maintenance program is in place. Reactive fleets face repeated audit findings and violations.
Route continuity is not optional
Missed school routes trigger parent complaints. Missed transit routes trigger rider complaints. Reactive maintenance produces unpredictable downtime that destroys route reliability -- the metric riders and parents care most about.
Board budgets are not flexible
Reactive maintenance produces spiky, unpredictable spending that blows up quarterly budgets. Preventive spending is planable, defensible, and can be modeled forward -- exactly what boards and finance directors need.
Driver retention is not optional
Drivers report bus reliability as a top job satisfaction factor. Chronic breakdowns drive drivers to competitor fleets. Preventive maintenance protects driver morale and reduces turnover costs.
Insurance is priced on data
Fleet insurance carriers reward documented PM programs with lower premiums. Reactive fleets pay more for coverage or face non-renewal after enough claims. The PM investment pays back through insurance alone.
Beyond Preventive: The Predictive Layer That Well-Run Fleets Use
The current best-practice for large bus fleets is not pure PM -- it is preventive maintenance layered with predictive/condition-based data. Here is what that looks like.
Reactive (Emergency Only)
Reserved for failures that slip through the preventive net. Well-run fleets keep this <10% of total maintenance activity.
Preventive (Foundation)
Scheduled PM cycles based on OEM specifications -- oil, filters, coolant, brakes, safety inspections. The base layer for 70-80% of activity.
Predictive (Data-Driven)
Condition-based decisions from fluid analysis, telematics fault codes, and cost-per-mile trending. Optimizes PM intervals from generic OEM specs to bus-specific reality.
How the layered model works in practice
A well-run bus fleet does not choose between reactive vs preventive. It runs all three approaches simultaneously, weighted heavily toward preventive with a predictive layer that fine-tunes intervals. Fluid analysis catches early engine wear. Telematics fault codes auto-generate work orders. Cost-per-mile trending flags which specific buses need more frequent PM than fleet standard. The CMMS ties all three tiers together into one workflow, so the shop foreman sees exactly what needs attention this week -- planned PMs, predictive alerts, and any emergency reactive work.
How BusCMMS Enables the Reactive-to-Preventive Transition
The barrier to shifting from reactive to preventive is not knowing PM is better -- it is the operational lift of implementing PM discipline across a live fleet. This is exactly what BusCMMS is designed for.
PM schedules pre-loaded Day 1
Bus-specific PM templates (fuel-type-aware for diesel, CNG, and electric) ship with the platform. No weeks of custom setup -- the schedule is ready for your fleet from the start.
Automated PM scheduling
Mileage, engine hours, and calendar-based PM triggers fire alerts before intervals expire. The CMMS runs the schedule -- the shop just executes it. No more "we forgot" as a maintenance category.
Digital DVIR + work order auto-generation
Bus-specific inspection forms capture pre-trip, PM, and event-based inspections. Any failed item automatically creates a work order for repair with parts + labor tracking.
Cost per mile tracking per bus
Every repair and PM cost tracked against the bus. Fleet-wide dashboards surface which buses run above fleet-average cost -- the ones that need attention or retirement.
Compliance reports on demand
FMCSA, FTA, NTD, and state DOT reports pull PM history and DVIR records automatically. Triennial reviews and audits become a report export, not a document scramble.
Telematics integration for predictive layer
Pre-built connectors to Samsara, Geotab, and other telematics platforms. Fault codes and odometer data flow into the CMMS to trigger work orders and PM cycles automatically.
BusCMMS reports districts saving an average of $2,800 per bus annually after shifting from reactive to preventive with the platform, with typical fleet availability climbing from 78% to 94% within 12 months of full rollout. Book a demo to see the transition workflow live on your fleet size.
What is the difference between reactive and preventive maintenance?
Reactive maintenance ("break-fix") repairs components after they fail. Preventive maintenance replaces or services components on a schedule based on time, mileage, or engine hours before they fail. For bus fleets, preventive is the industry standard because it produces higher fleet availability (90-95% vs 70-85%), lower cost per mile (roughly 40-50% less), and much lower safety and compliance risk. Reactive maintenance still plays a role for consumables and end-of-life buses, but pure reactive management is inappropriate for safety-critical bus systems.
How much does preventive maintenance save vs reactive maintenance?
Well-managed preventive maintenance programs typically reduce total maintenance cost per mile by 40-50% versus reactive-run fleets. Emergency repairs cost 3-5x more than planned repairs when parts, labor, tow, and downtime are all totaled. BusCMMS reports districts using its platform save an average of $2,800 per bus per year after transitioning to preventive maintenance -- that is $84,000 annually on a 30-bus fleet, or $252,000 over a three-year window.
What is predictive maintenance and how does it fit in?
Predictive maintenance uses data (fluid analysis, telematics fault codes, cost-per-mile trending, vibration analysis) to condition-time PM intervals to actual equipment state rather than generic OEM specifications. It sits on top of a preventive foundation, not as a replacement for it. Modern well-run bus fleets typically run all three tiers -- preventive as the base (70-80% of activity), predictive as the optimization layer, and reactive reserved for the small percentage of failures that slip through (<10%). The CMMS ties all three together into one workflow.
How long does it take to switch from reactive to preventive maintenance?
The software rollout of a bus-specific CMMS typically takes 2-4 weeks -- data migration, PM schedule loading, technician training, and DVIR form configuration. The operational transition -- shifting shop culture and driver behavior from firefighting to planned maintenance -- takes 6-12 months to fully embed. Measurable improvements in fleet availability, cost per mile, and road call reduction usually show up within the first 3-6 months of consistent PM execution.
How does BusCMMS help fleets transition from reactive to preventive?
BusCMMS ships with bus-specific PM schedules pre-loaded (diesel, CNG, and electric fuel-type variants) so no custom setup is required. Digital DVIRs, work order auto-generation from failed inspections, mileage and hours-based PM triggers, cost per mile tracking per bus, and compliance reporting are all built in. Telematics integration (Samsara, Geotab, and others) enables the predictive layer. Typical deployment is 2-4 weeks. Book a 20-minute demo to see the reactive-to-preventive workflow shift live, or start a 30-day free trial to run the platform against your fleet data.







