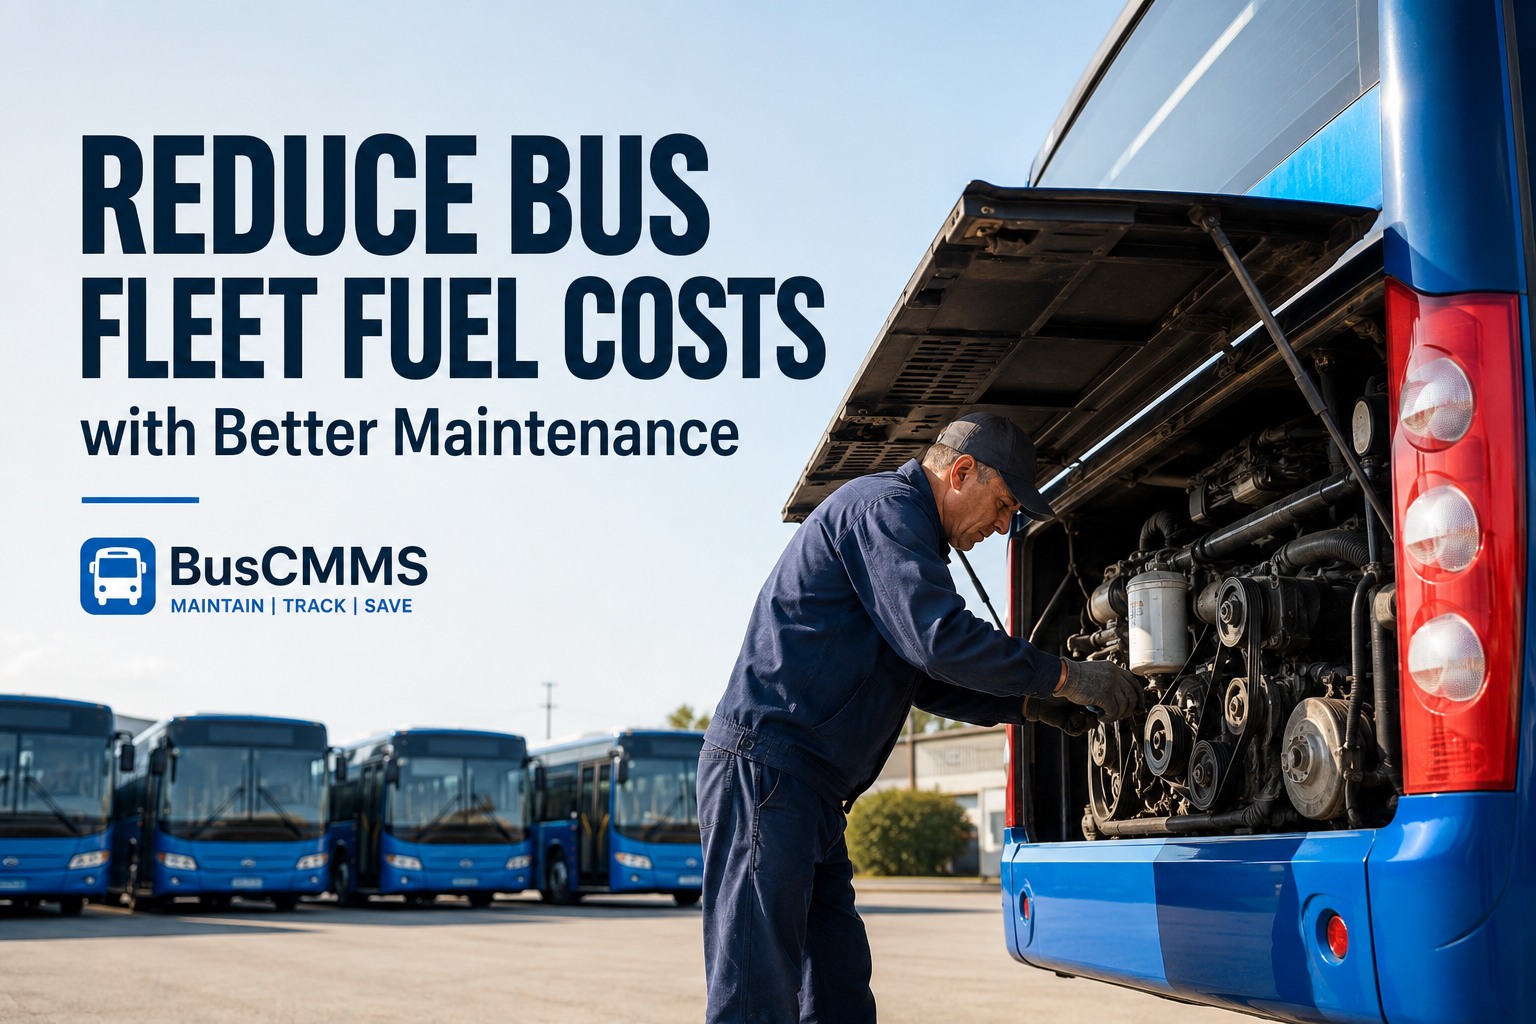
Your 40-bus diesel fleet burns roughly 200,000 gallons of fuel a year. At $4.10 per gallon, that is $820,000 out the door in fuel alone. Now imagine that same fleet is running 15% below its potential MPG because of preventable maintenance issues -- under-inflated tires, clogged air filters, misaligned wheels, worn injectors. That 15% is $123,000 a year in fuel you did not have to spend. Reducing bus fleet fuel costs is not about buying cheaper fuel or hoping diesel prices come down. It is about the 10 maintenance items that quietly cost you two mpg per bus,and $3,000-$5,000 per bus in fuel every year they go unfixed.
Reduce Bus Fleet Fuel Costs Through Preventive Maintenance
The 10 maintenance items that directly determine your fleet's miles per gallon, the real dollar impact per bus per year, and how a bus CMMS captures and reports the fuel savings before your board meeting.
-
01
Wheel Alignment5-10% MPG
-
02
Tire Pressure3-10% MPG
-
03
DPF + Aftertreatment5-8% MPG
-
04
Brake Drag3-8% MPG
-
05
Air Filter3-5% MPG
-
06
Fuel Injectors2-4% MPG
-
07
Engine Oil Grade1-3% MPG
Why Fuel Is Where the Real Money Is
Fuel is not just a line item -- it is the single largest variable operating cost in most bus fleet budgets. Small MPG improvements produce large dollar savings.
Transit fleet operating cost
Fuel represents 30-40% of transit bus operating costs. Any MPG improvement compounds directly to the bottom line, month after month.
School bus operating cost
Fuel is a smaller portion of school bus operating cost, but still one of the top three expense categories after labor and insurance.
Preventable loss per bus
Poorly-maintained buses waste $3,000-$5,000 in fuel per bus per year compared to well-maintained equivalents. Add up across a fleet and it is real money.
MPG improvement potential
Fleets that transition from reactive to preventive maintenance typically see 15-25% MPG improvement in the first 12 months. Larger gap when starting from severe neglect.
Book a demo to see how BusCMMS captures fuel consumption per bus + trending MPG over time.
10 Maintenance Items That Determine Your Fleet's MPG
Every one of these has been measured across multiple fleet studies. The MPG percentages below reflect typical impact ranges when the item is neglected vs properly maintained.
Wheel Alignment
5-10% MPG loss when neglectedMisaligned wheels drag the bus sideways every mile. The engine works harder to maintain speed against that resistance, and tires wear unevenly which compounds the effect. Fleets that check alignment every 12-18 months (or after any curb impact) recover the full MPG.
Tire Pressure + Rolling Resistance
3-10% MPG loss when under-inflatedUnder-inflated tires flex more with every rotation, converting energy into heat instead of forward motion. Every 10 PSI below spec on heavy-duty tires costs measurable MPG. School and transit buses running 4-6 tires under-inflated across the fleet are burning fuel to warm the tires.
DPF + Aftertreatment System
5-8% MPG loss when restrictedDiesel Particulate Filter (DPF) plugs up as it captures soot. When restricted, exhaust back-pressure climbs and the engine has to work harder to push exhaust out. Result: less power available and worse MPG. Regen cycles also burn extra fuel. Regular DPF cleaning + DEF quality control matters.
Brake Drag (Sticking Calipers)
3-8% MPG loss when brakes dragA single dragging caliper adds constant resistance the engine has to overcome. Sometimes obvious (bus pulls to one side), often invisible (mild drag that produces heat and worn pads). Brake pad wear should be even across the axle -- uneven wear is the tell.
Air Filter Restriction
3-5% MPG loss when cloggedClogged air filter restricts intake air, which forces the engine to work harder for the same combustion. Modern diesel engines have restriction indicators that most fleets ignore. Replacing the filter on interval (or on indicator) recovers the full MPG immediately.
Fuel Injector Condition
2-4% MPG loss when dirty or wornDirty or worn injectors produce imperfect spray patterns. Incomplete combustion wastes fuel and generates more soot for the DPF to catch. Fuel quality management (water separator drains, filter interval discipline) protects injectors. Injector cleaning at OEM intervals restores efficiency.
Fuel Filter + Water Separator
2-4% MPG loss when restrictedRestricted fuel filter forces the injection pump to work harder to draw fuel through, and water contamination directly impairs combustion. Every skipped separator drain and overdue filter change is fuel dollars being wasted. Also protects the $3K-$8K injection pump.
Engine Oil Grade + Change Interval
1-3% MPG loss with wrong oil or extended intervalsWrong oil viscosity (too thick) increases internal engine drag. Old oil loses viscosity and additives, causing more friction. Using the OEM-specified oil grade and hitting change intervals delivers the smaller but still real MPG protection. Fluid analysis extends confidence in interval.
Turbocharger Health
5-15% MPG loss on failing turboA failing turbo dramatically reduces air-fuel efficiency. Often shows up as reduced power under load before MPG loss is quantified. Boost pressure testing at PM catches the trend before full failure. Turbo replacement is not cheap but the fuel savings + power recovery justify it.
Cooling System Health
2-4% MPG loss when operating temp is wrongEngine running too cold (bad thermostat) wastes fuel through incomplete combustion and richer fuel mapping. Running too hot causes ECU to derate power. Both hurt MPG. Cooling system PM keeps operating temp in the efficient band.
Book a demo to see how BusCMMS tracks each of these items per bus + surfaces MPG trends.
Real Fleet Fuel Bill: Neglected vs Well-Maintained
Concrete numbers for a 40-bus diesel fleet running 30,000 miles per bus per year at $4.10/gallon diesel. Actual results vary by region and fuel prices.
- Fleet miles/yr1.2M
- Gallons burned203,390
- Cost @ $4.10/gal$833,900
- Per bus$20,848
- Fleet miles/yr1.2M
- Gallons burned171,430
- Cost @ $4.10/gal$702,860
- Per bus$17,572
The Driver Behavior + Idling Layer
Maintenance sets the ceiling on fleet MPG. Driver behavior determines how close you actually get to that ceiling. These four items compound with mechanical maintenance for the full picture.
Excessive Idling
Idling burns 0.5-1.0 gallon per hour producing zero miles. School buses idling 30 minutes per shift waste 3-6 gallons per bus per week. Fleet-wide idling policies + telematics enforcement recover this immediately.
Aggressive Acceleration
Hard acceleration burns fuel at 2-3x normal rate. School bus drivers who accelerate hard from every stop waste measurable MPG over a route. Driver coaching plus telematics scorecards reduce this pattern quickly.
Highway Speed Management
Fuel consumption climbs sharply above 55 mph on heavy-duty diesels. Every 5 mph above 60 costs 3-7% MPG. Route governance + driver awareness pay off measurably on any bus that runs highway miles.
Braking + Downshift Patterns
Reactive braking (brake hard, accelerate hard) wastes fuel through kinetic energy loss. Proper anticipation + progressive deceleration converts to gliding rather than braking, meaningfully reducing fuel consumption on urban routes.
Book a demo to see how BusCMMS integrates telematics data to surface driver MPG variance.
How BusCMMS Turns Fuel Data Into Savings
You cannot manage what you do not measure. Fuel savings only show up on the fleet P&L when the CMMS captures consumption per bus, per route, per driver, and surfaces the trends.
Fuel consumption per bus
Every fuel-up captured against the specific bus with gallons, cost, odometer reading, and calculated MPG. Fleet dashboard surfaces buses trending above or below fleet-average MPG.
MPG drop alerts
When a specific bus's MPG drops meaningfully from its baseline, an alert fires. This catches early fuel-system issues, DPF restriction, or dragging brakes before they become expensive repairs.
Fuel card reconciliation
Fuel card imports (Voyager, others) reconcile against odometer readings and route history. Catches fuel theft, wrong-vehicle fill-ups, and unauthorized personal use.
Per-driver MPG scorecards
When telematics data flows into the CMMS, MPG can be attributed per driver per route. Surfaces the drivers running 10-15% below fleet average -- and the ones outperforming.
Per-route fuel analysis
Routes have different fuel profiles based on terrain, stops, and traffic. Tracking fuel per route surfaces the routes running high fuel and worth review for optimization.
Historical fuel + cost reports
Multi-month and multi-year fuel consumption + cost reports for board presentations, budget forecasting, and grant applications. Documented savings are defendable savings.
Book a demo to see fuel consumption tracking + MPG alerts + reporting live on your fleet.
Annual Fuel Savings by Fleet Size
Real dollar impact of moving from neglected MPG (5.9) to well-maintained MPG (7.0) across three typical fleet sizes. Based on 30,000 mi/bus/yr at $4.10/gal.
How much can preventive maintenance actually reduce bus fleet fuel costs?
Well-managed preventive maintenance programs typically deliver 15-25% MPG improvement over neglected fleets, translating to $3,000-$5,000 in annual fuel savings per bus. For a 40-bus fleet, that is $120,000-$200,000 in annual fuel savings. Actual results vary based on starting condition, route type, and diesel prices, but every fleet that transitions from reactive to preventive maintenance sees measurable fuel cost reduction in the first 6-12 months.
Which maintenance item has the biggest single impact on fuel efficiency?
Wheel alignment (5-10% MPG impact) and tire pressure (3-10% MPG) are usually the biggest single-item impacts on bus fleet fuel economy. Both are easy to address and produce immediate improvement when corrected. DPF and aftertreatment issues (5-8% MPG) come next and are common on older buses running short-cycle school routes where DPF regens run frequently. All three are catchable with routine PM inspection.
How does driver behavior affect fleet fuel costs vs maintenance?
Maintenance sets the MPG ceiling. Driver behavior determines how close you get to it. Driver-to-driver MPG variance on the same bus and route is typically 8-15%. Aggressive acceleration, excessive idling, hard braking, and highway speeding all compound with mechanical maintenance issues. The full fuel savings picture requires both -- disciplined preventive maintenance to set the ceiling, plus driver training and telematics scorecards to drive behavior toward the ceiling.
How quickly do fuel savings from better maintenance show up in the fleet budget?
Individual maintenance actions produce immediate MPG improvements -- correcting tire pressure or replacing a clogged air filter shows up in the next fuel-up. Fleet-wide savings take 3-6 months to fully materialize as PM cycles run their course across the fleet. Cumulative annual savings show up on the year-end fuel budget, which is why capturing per-bus fuel data from Day 1 of the CMMS deployment matters -- you need the baseline to prove the savings.
How does BusCMMS help reduce fuel costs specifically?
BusCMMS captures fuel consumption per bus at every fill-up (gallons, cost, odometer, calculated MPG), fires alerts when a bus's MPG drops below its baseline, reconciles fuel card data (Voyager, others) against odometer readings, and surfaces per-driver + per-route fuel analytics when telematics integration is enabled. Historical fuel + cost reports support budget forecasting, board presentations, and grant applications. Book a 20-minute demo to see fuel savings tracking live, or start a 30-day free trial to run against your fleet data.







